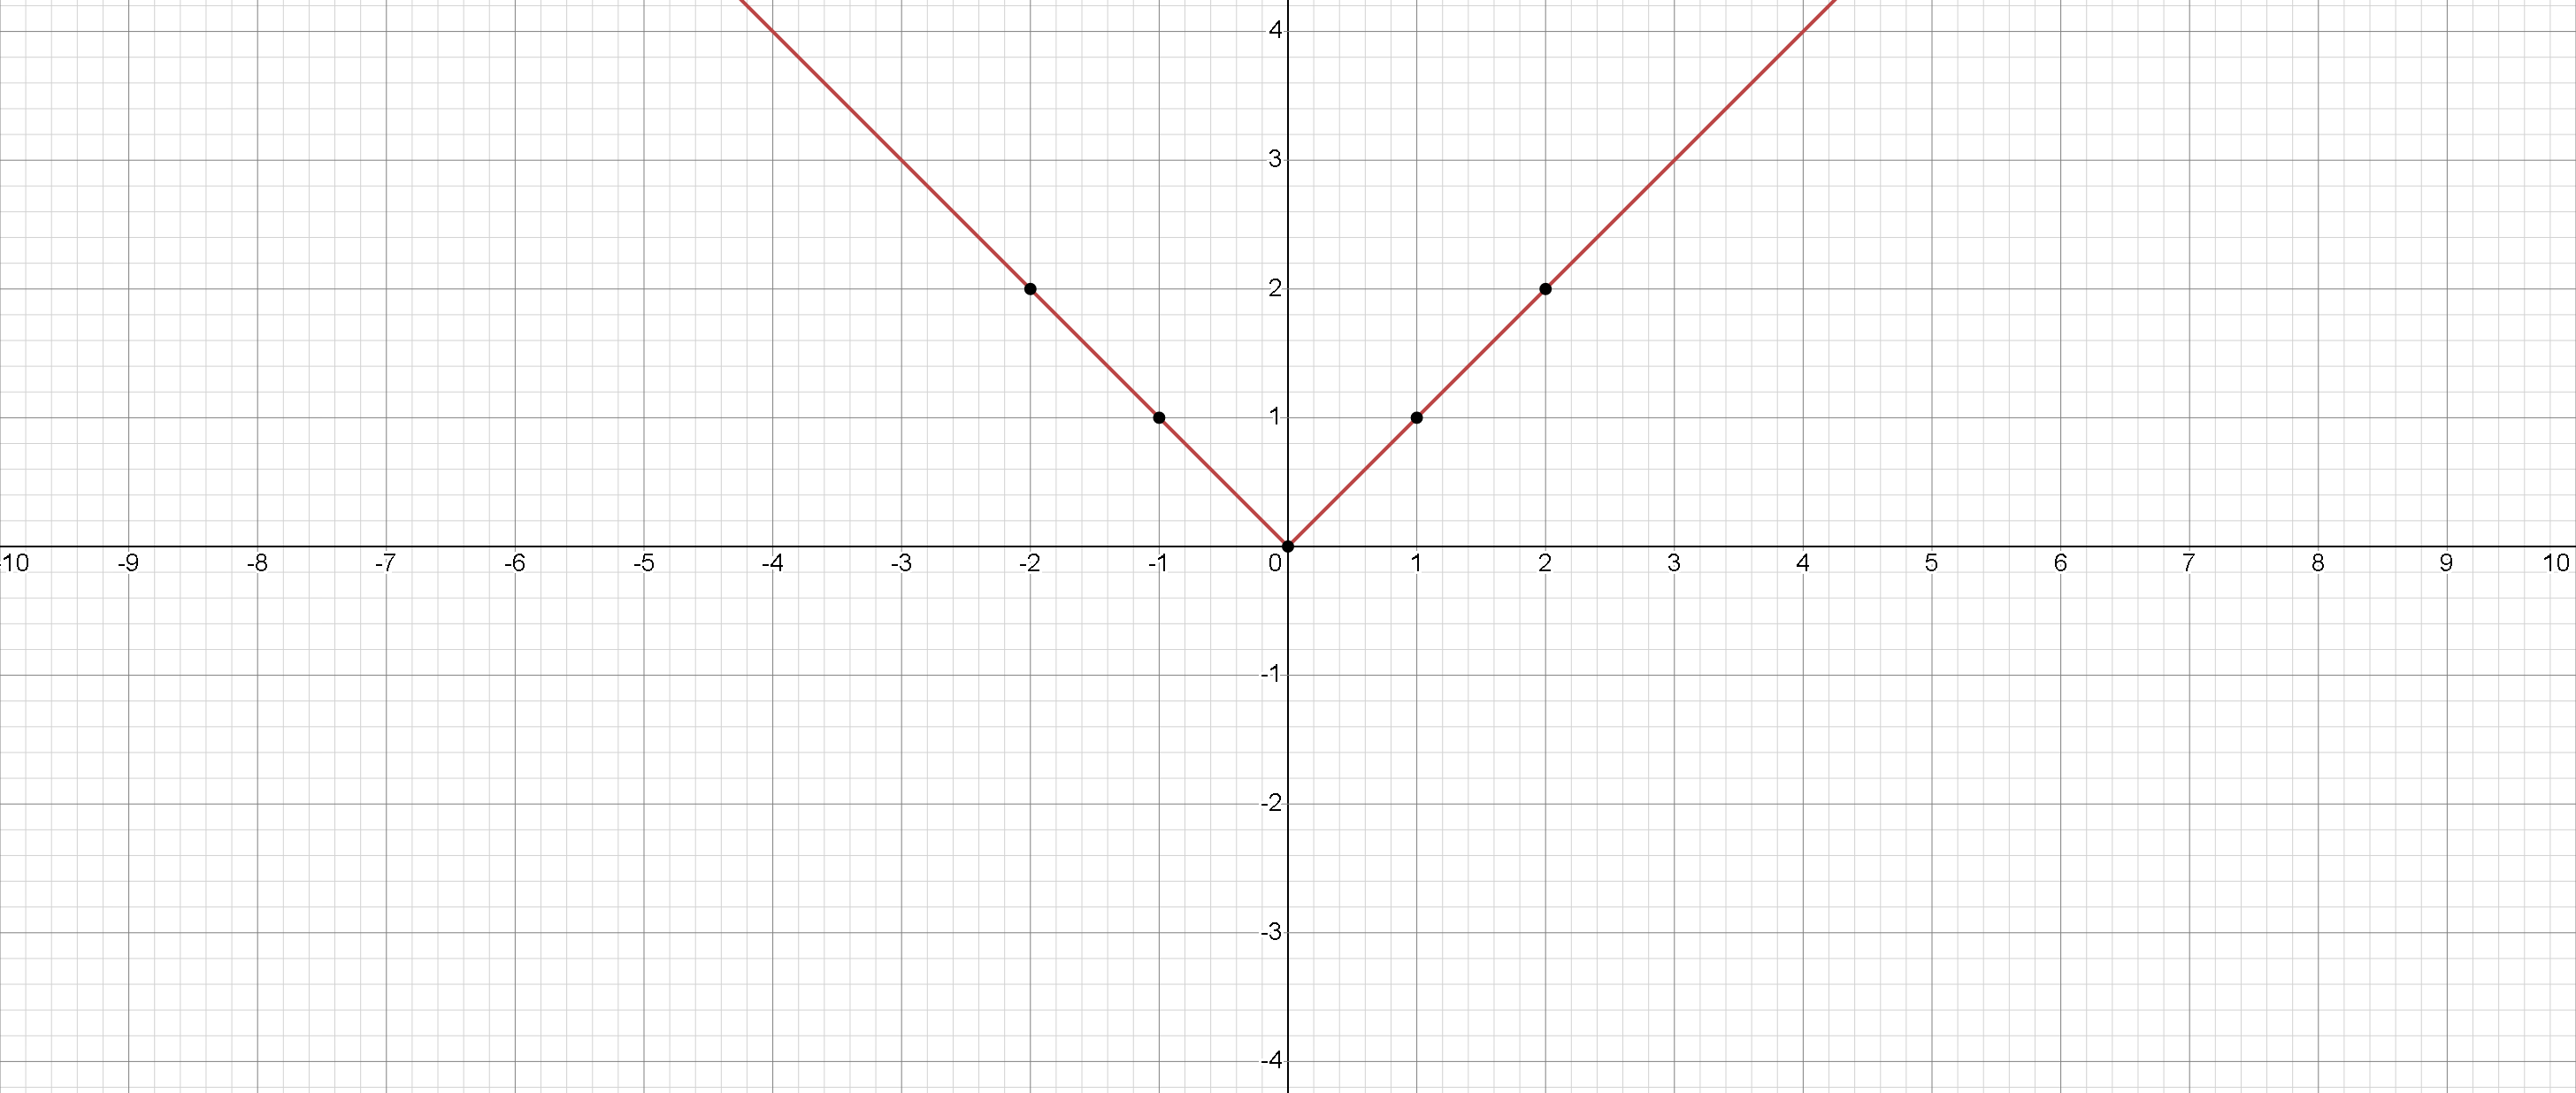
Absolute Value Function
The graph of y = |x| forms a V-shape, where all outputs are non-negative.
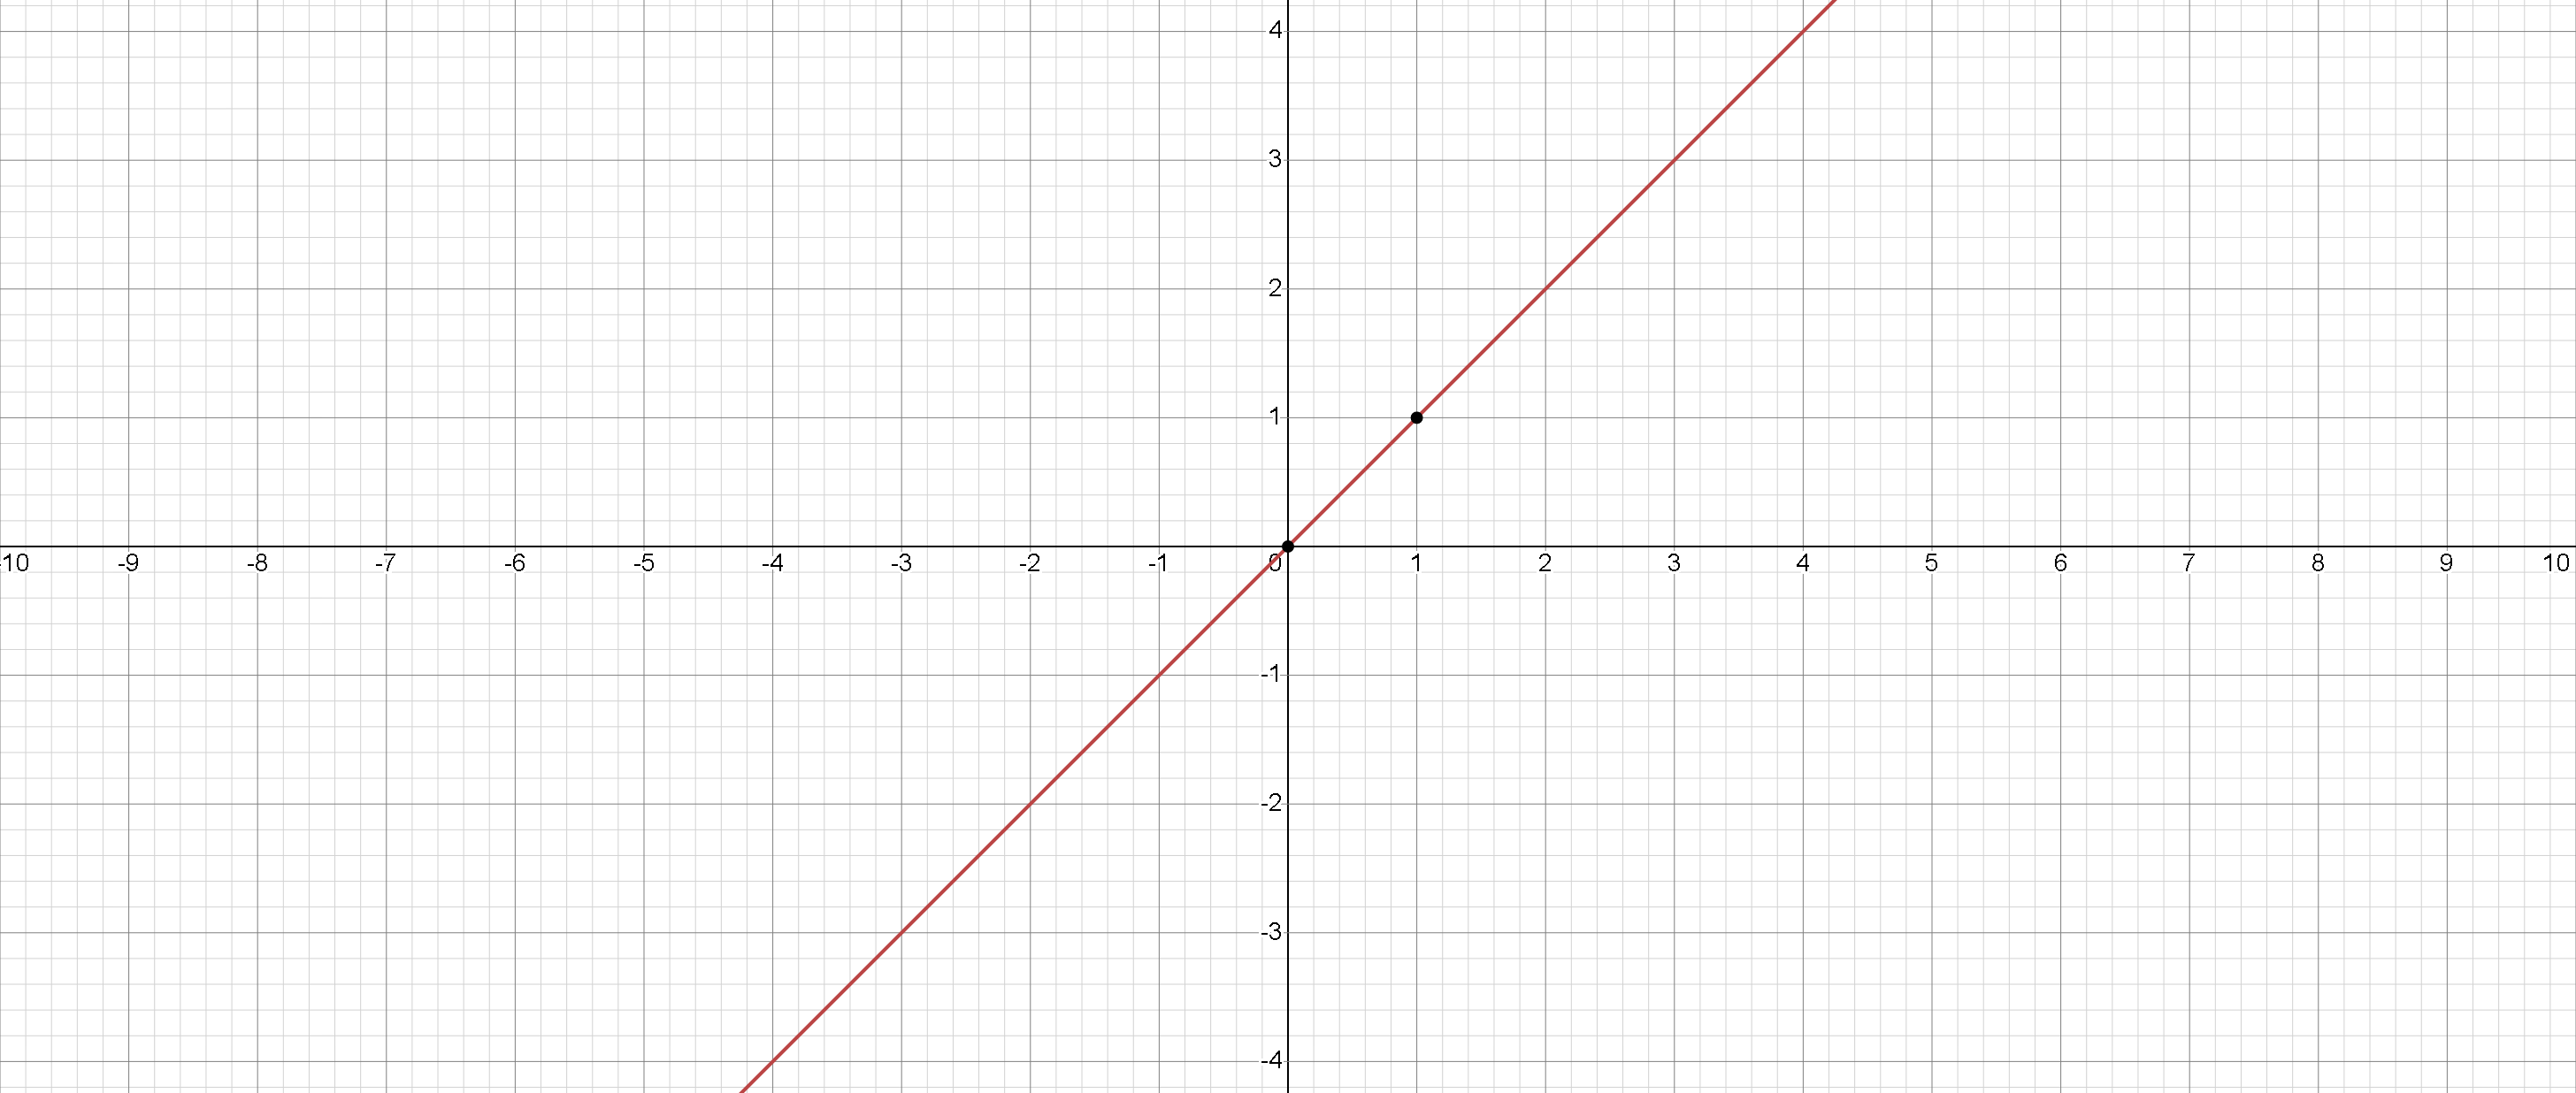
Linear Function
The graph of y = x is a straight line passing through the origin with a slope of 1.
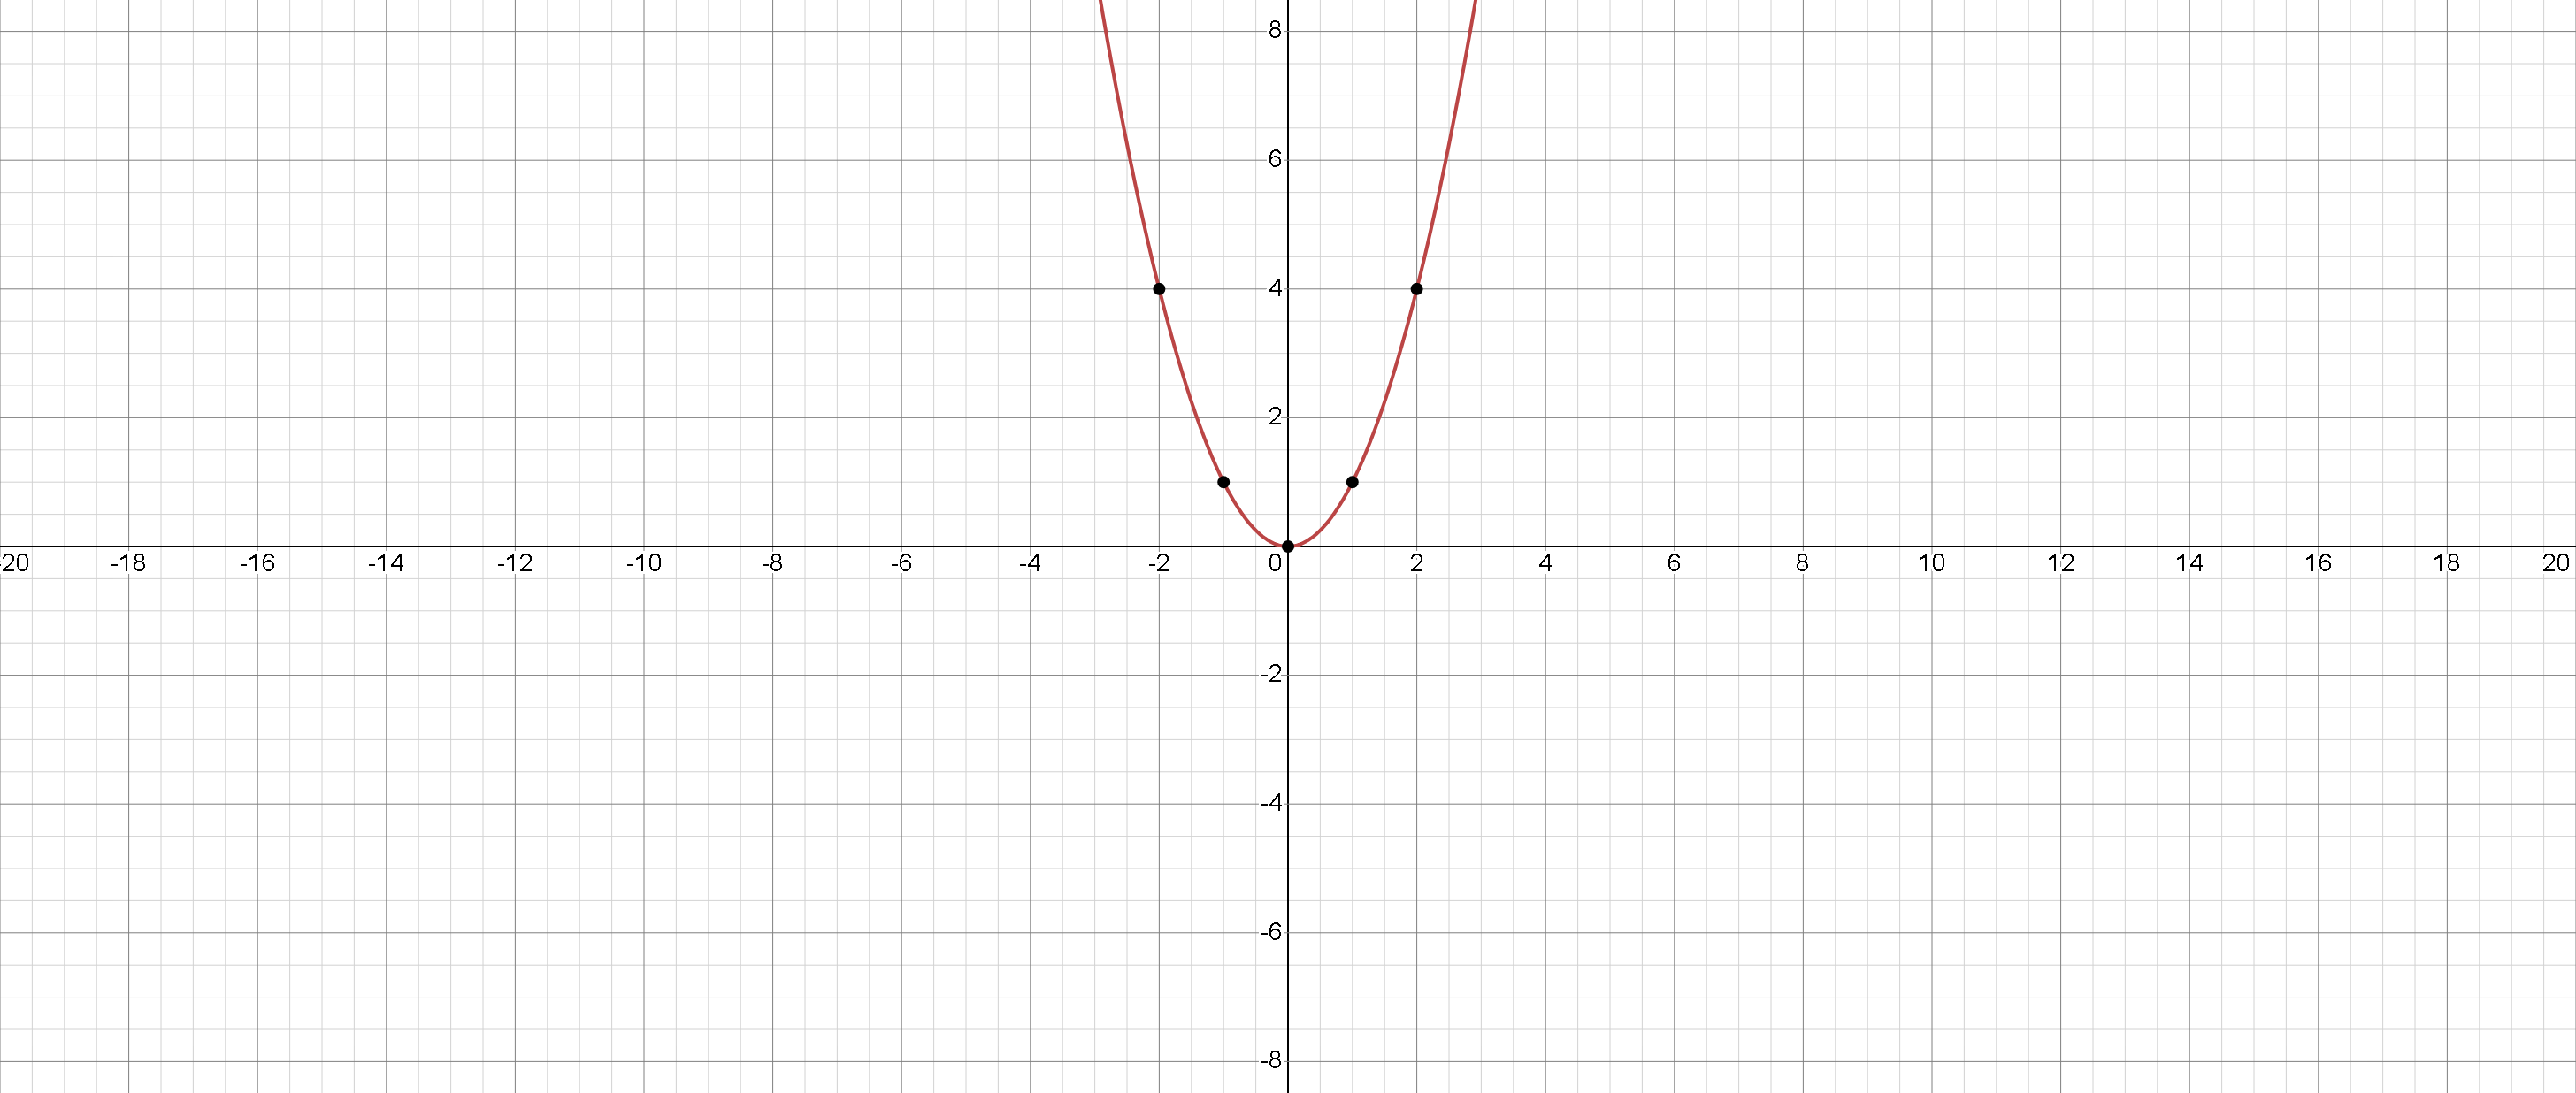
Quadratic Function
The graph of y = x 2 is a parabola opening upwards, with its vertex at the origin.
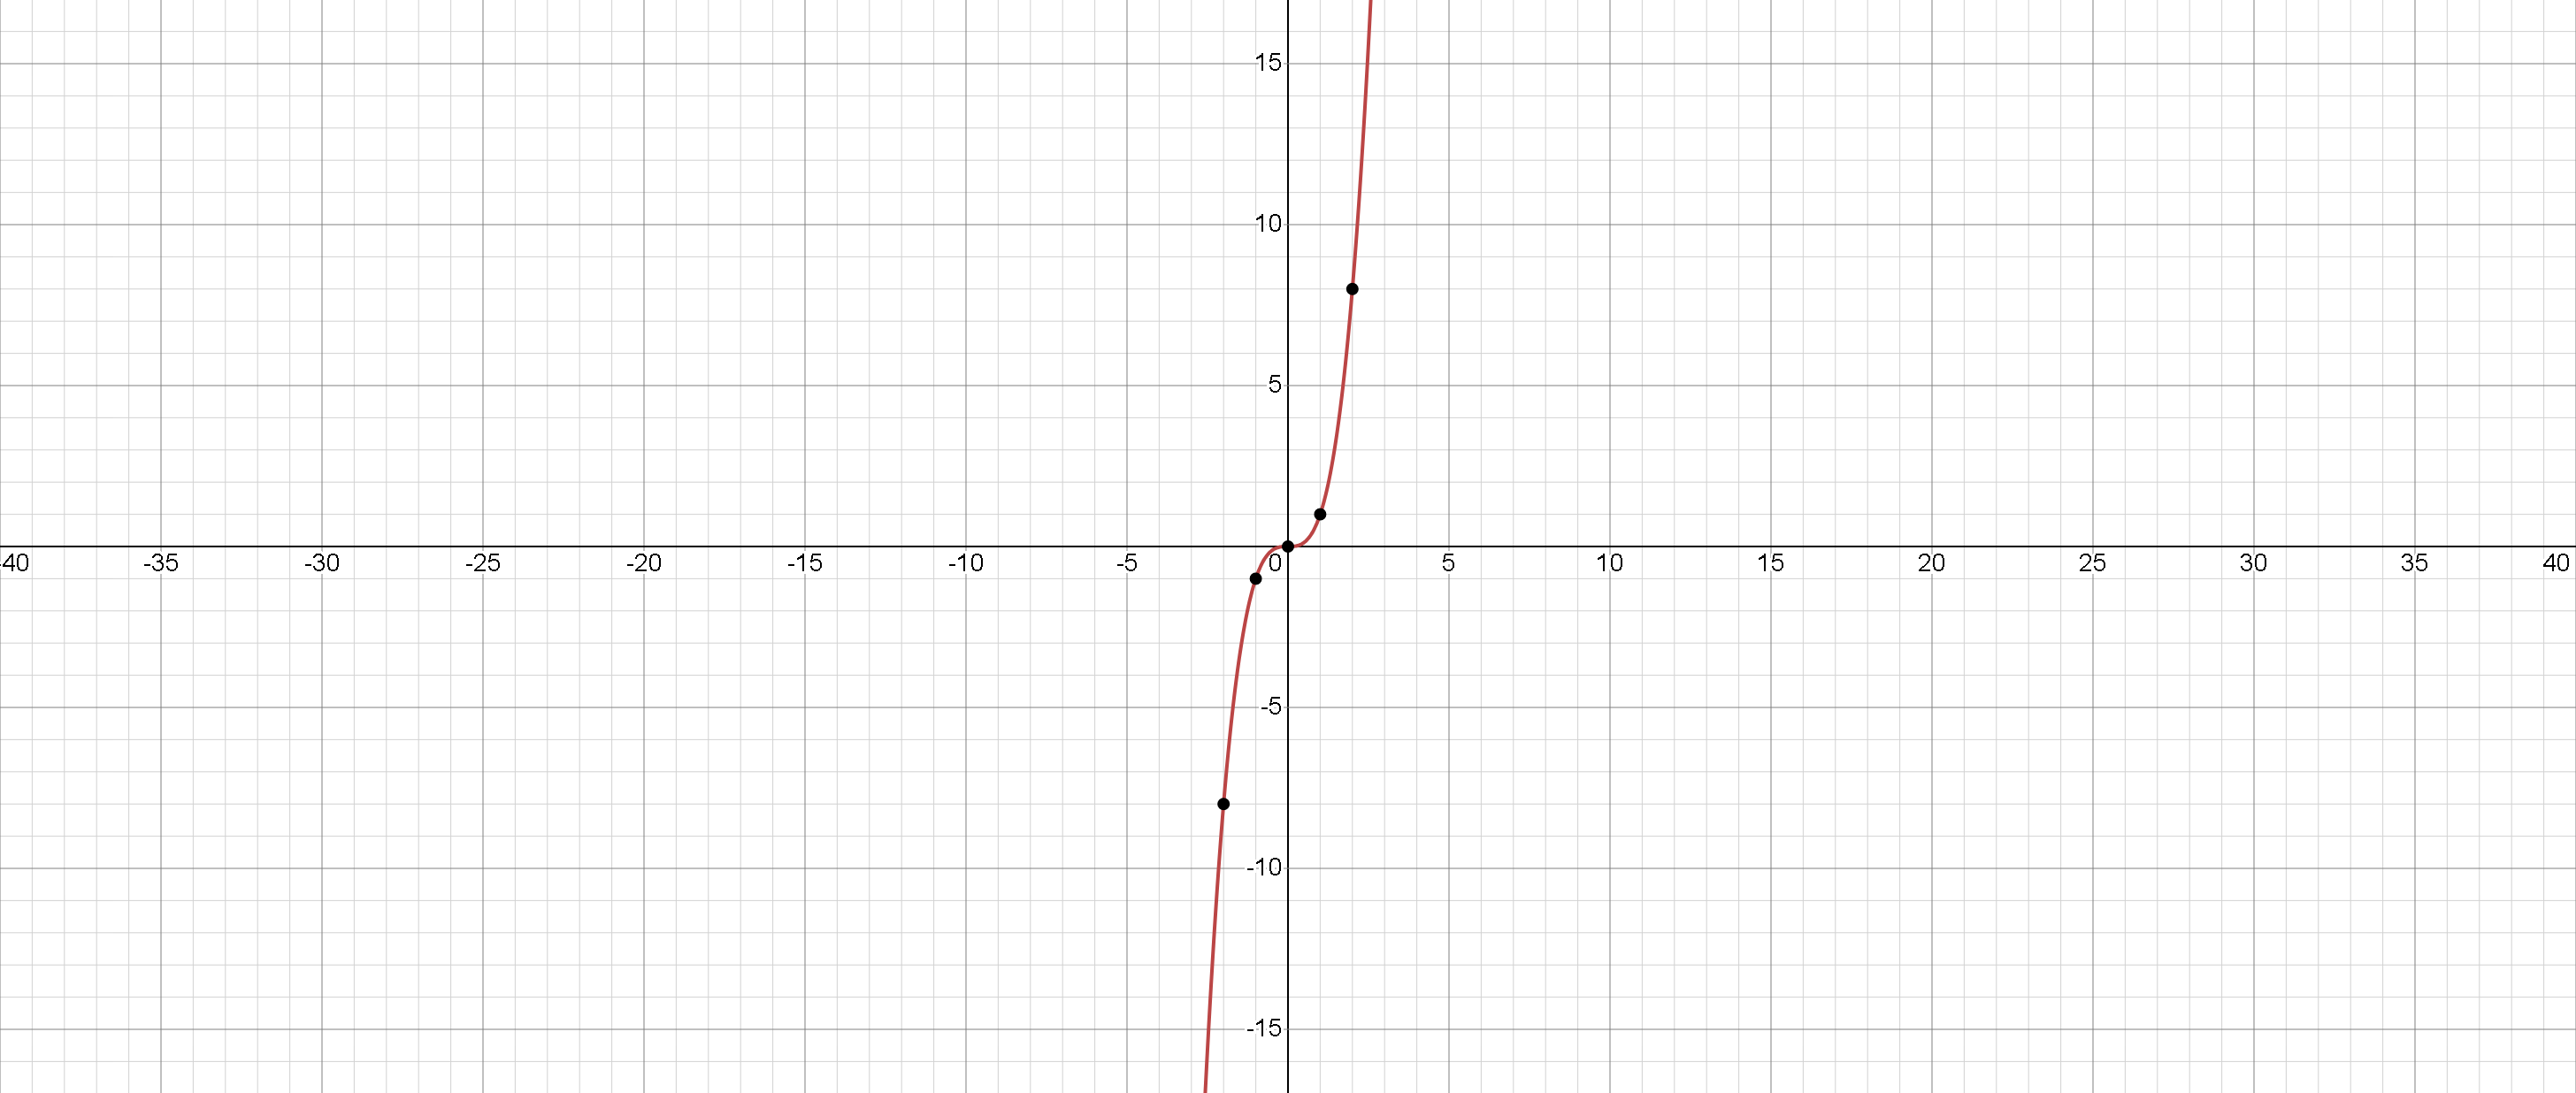
Cubic Function
The graph of y = x 3 shows an S-shaped curve passing through the origin.
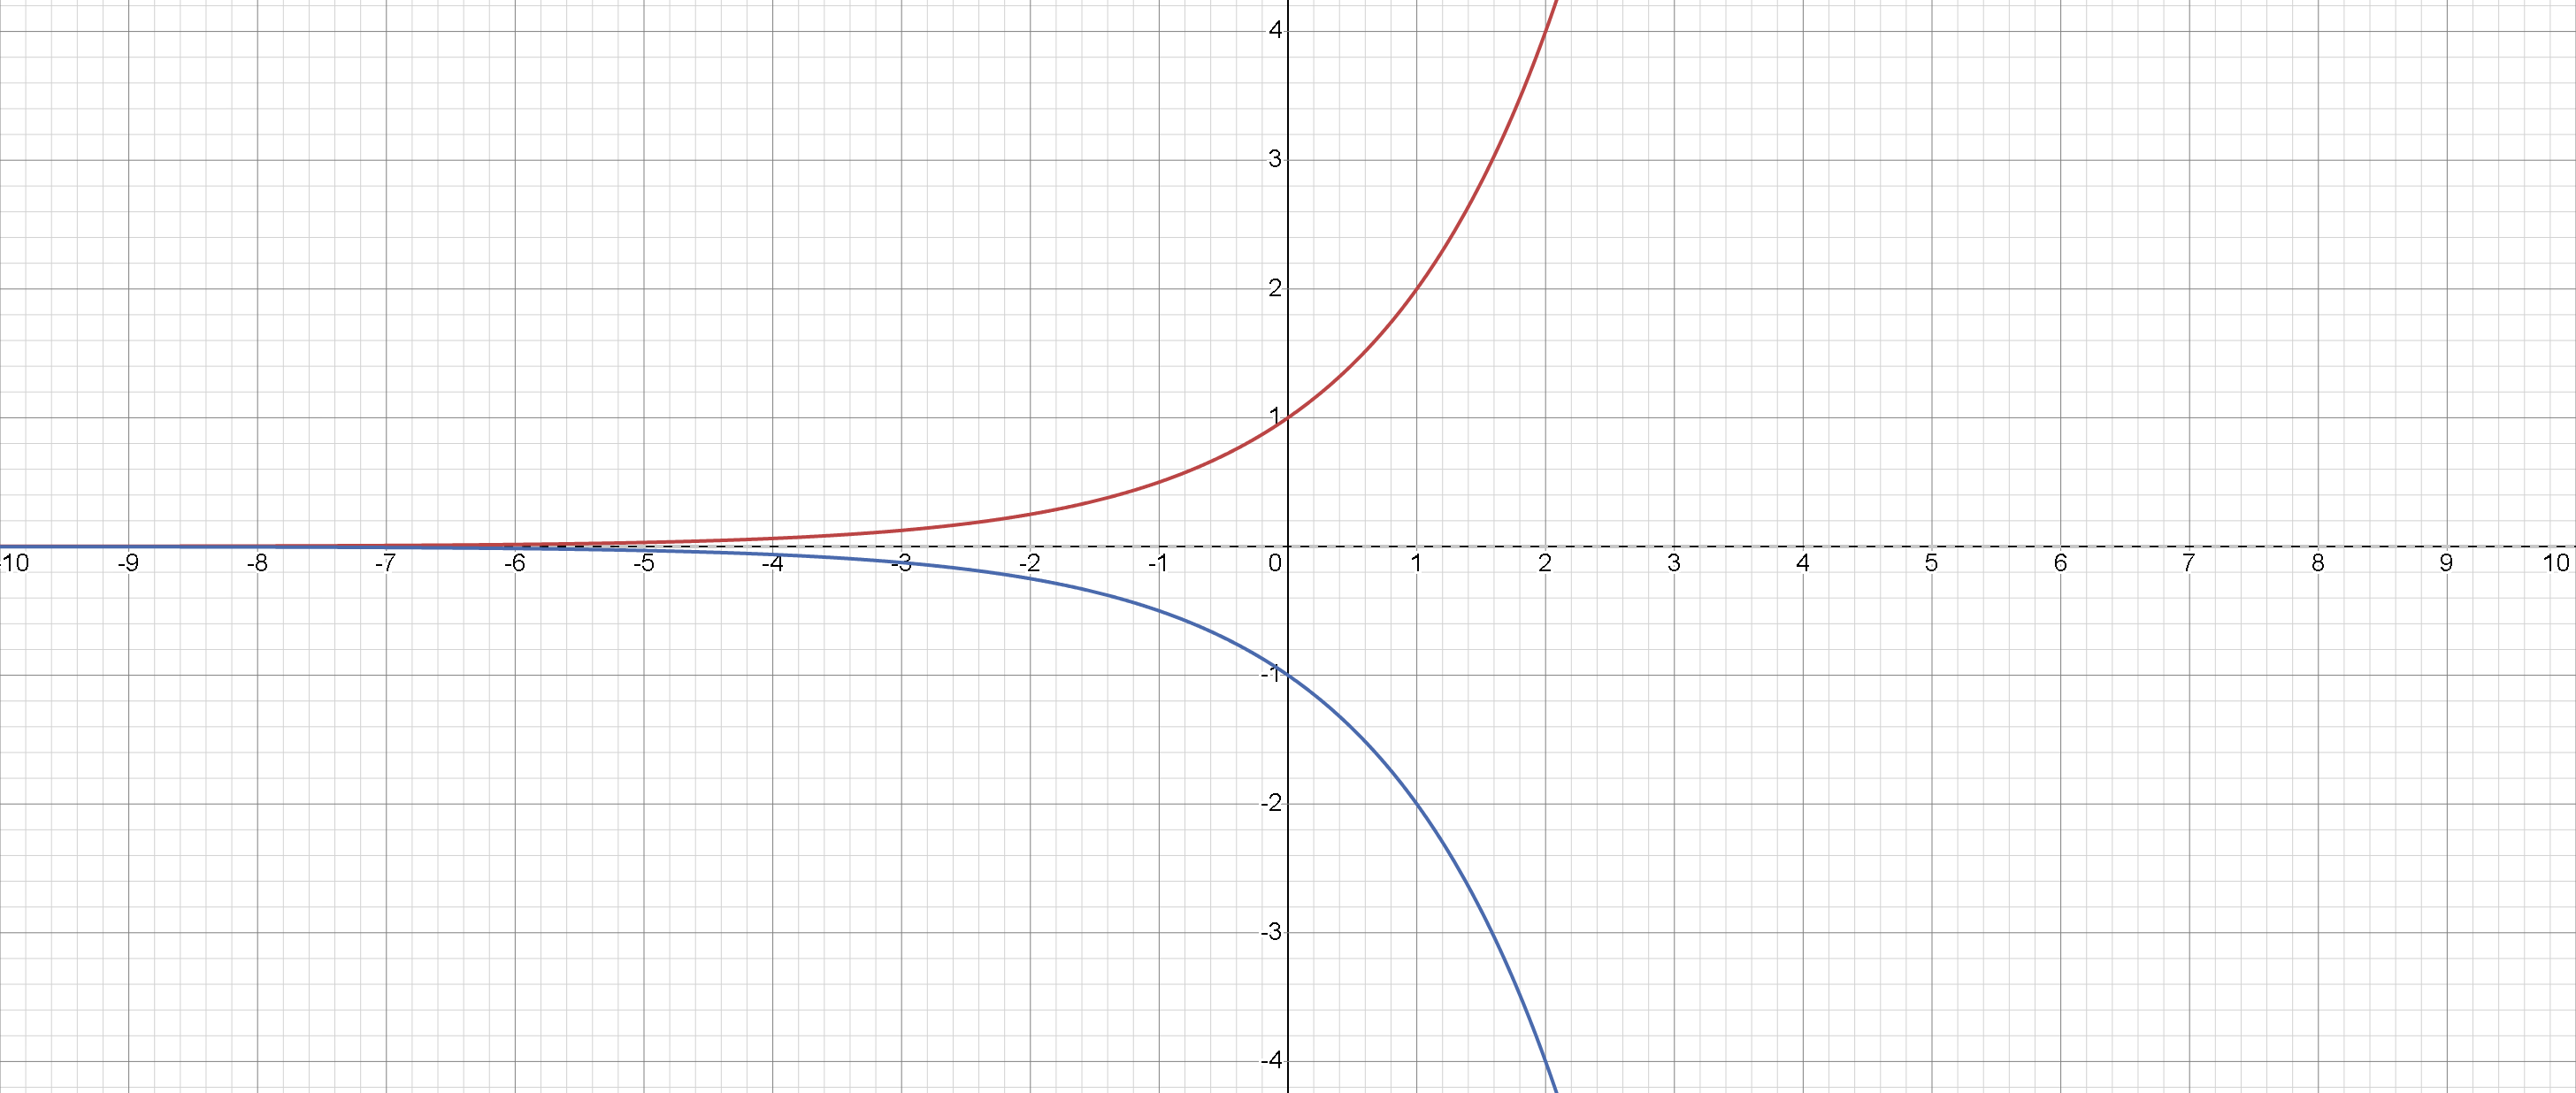
Exponential Functions
The graphs of y = a x and y = -a x represent exponential growth and decay.
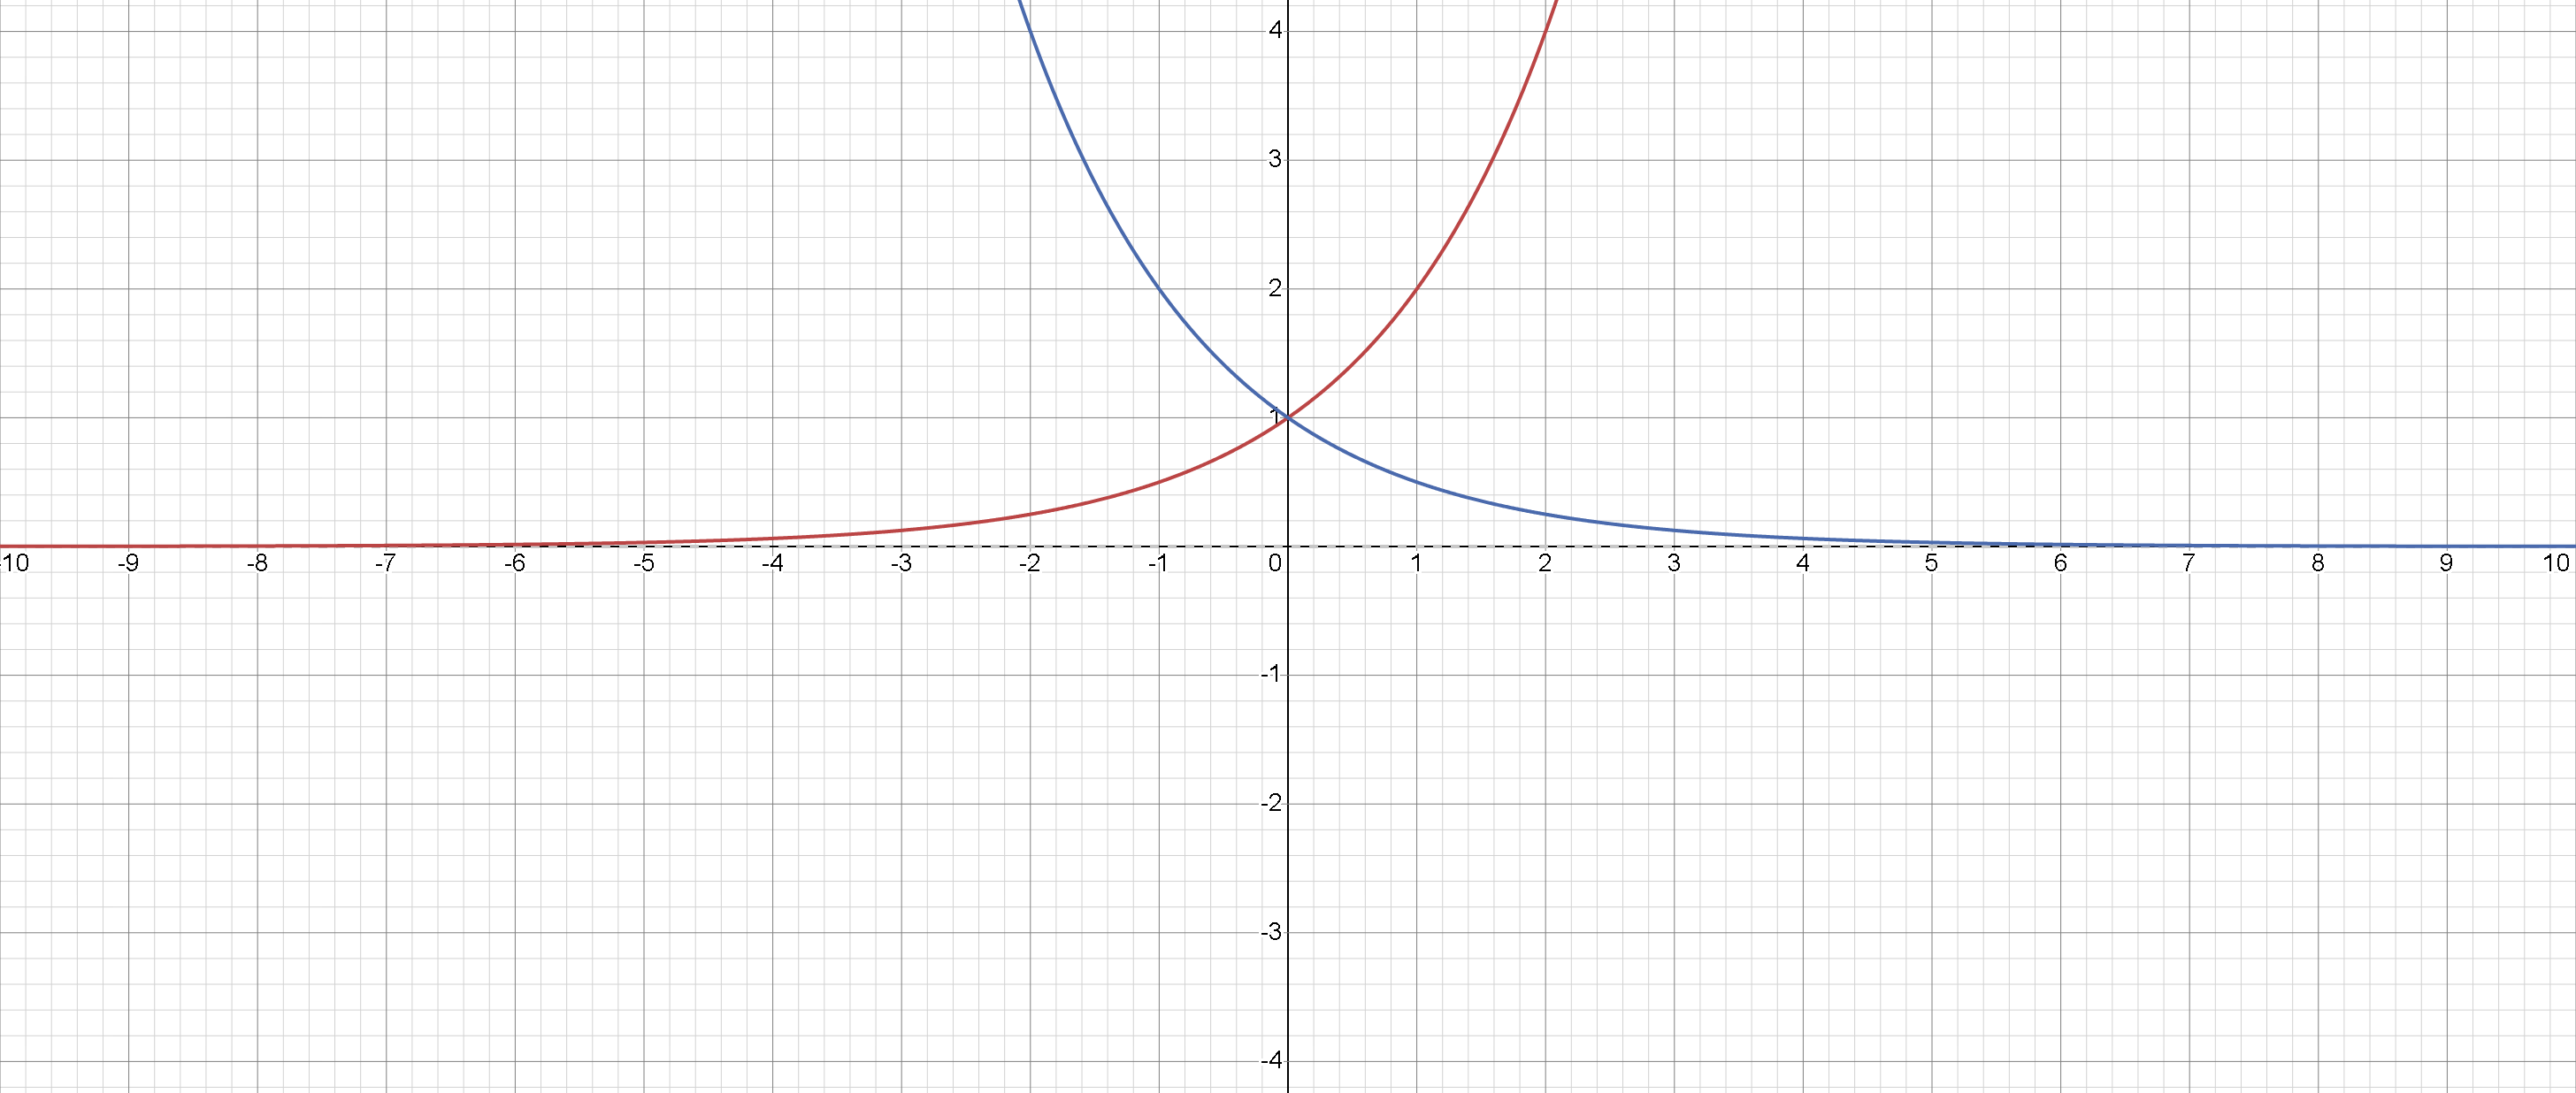
Inverse Exponential Functions
The graphs of y = a x and y = a -x show growth and decay with an inverse relationship.
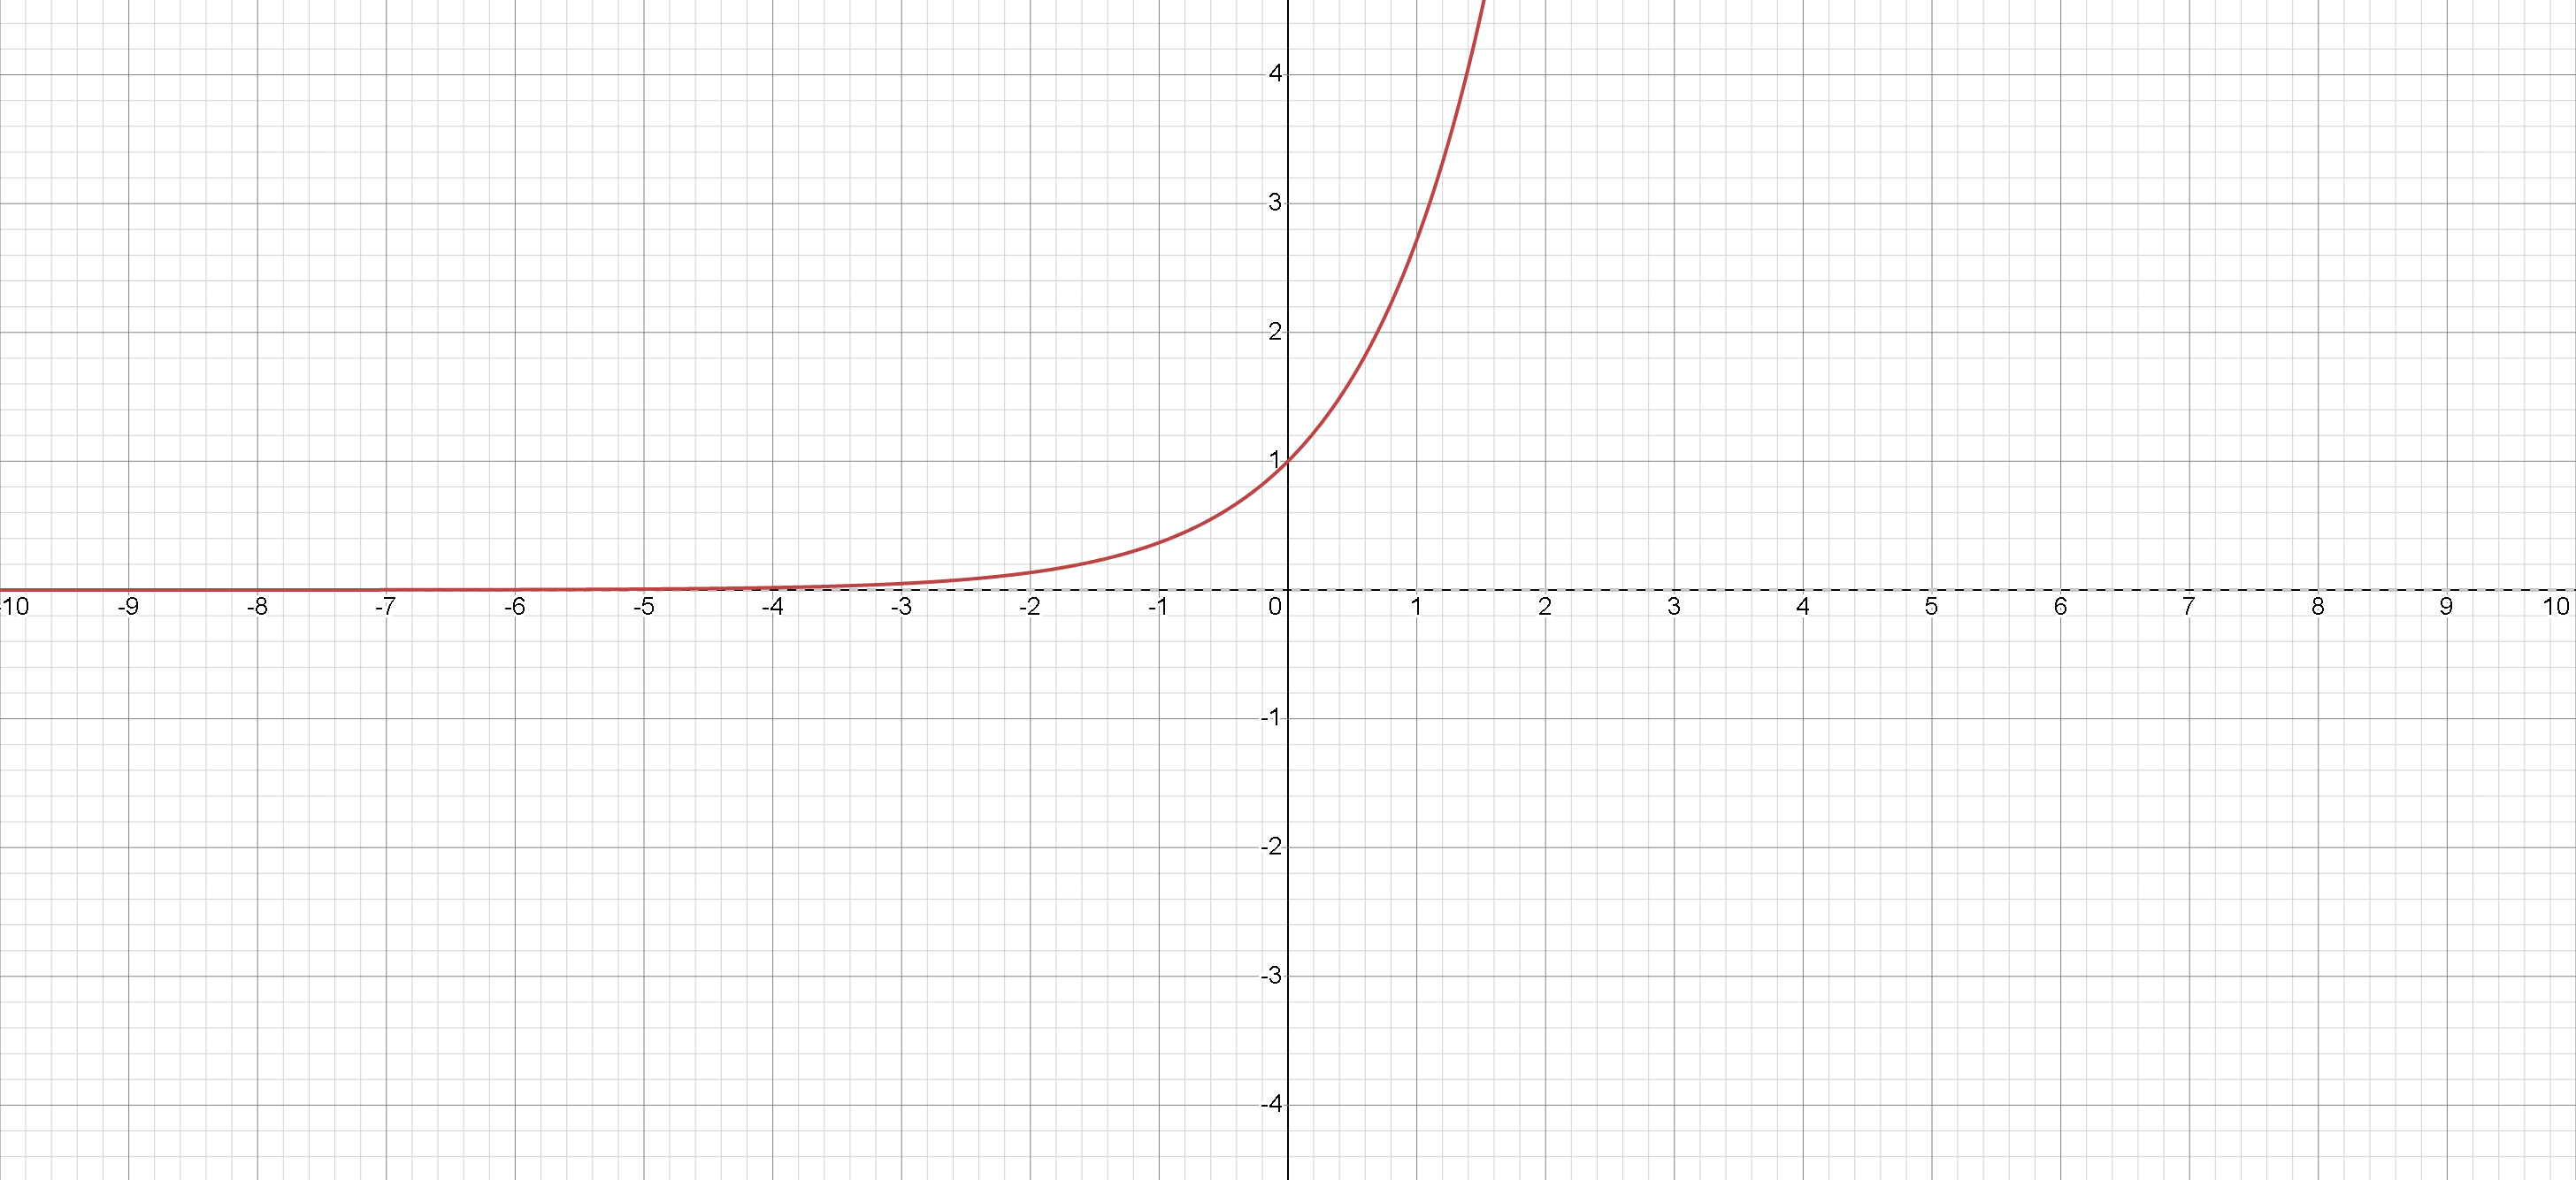
Natural Exponential Function
The graph of y = e x illustrates continuous exponential growth with base e .
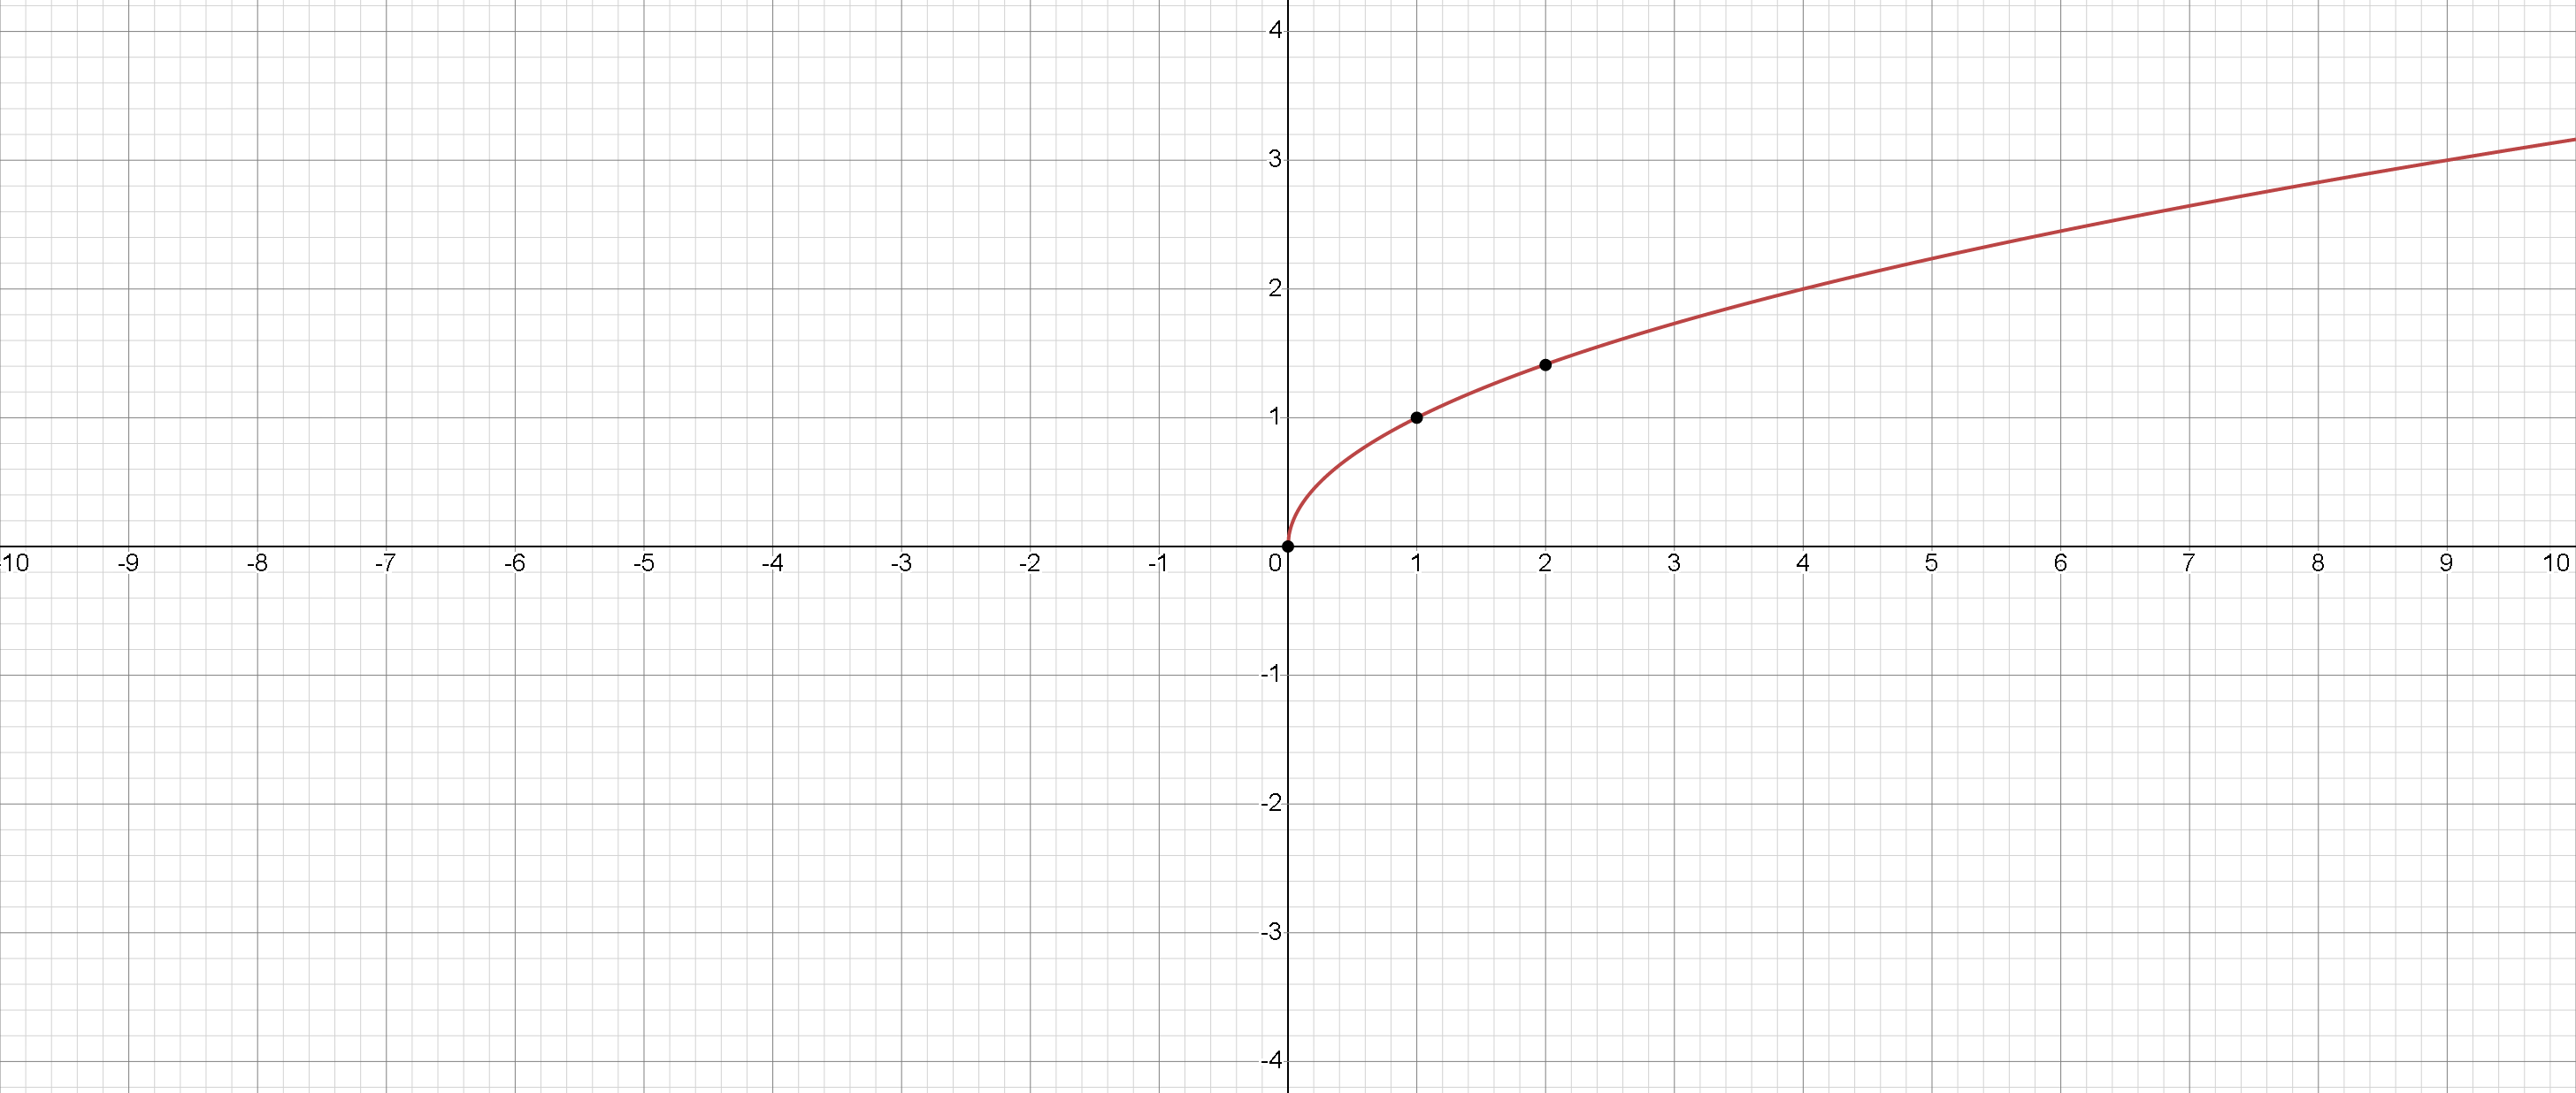
Square Root Function
The graph of y = √x is a curve in the first quadrant, showing non-negative outputs.
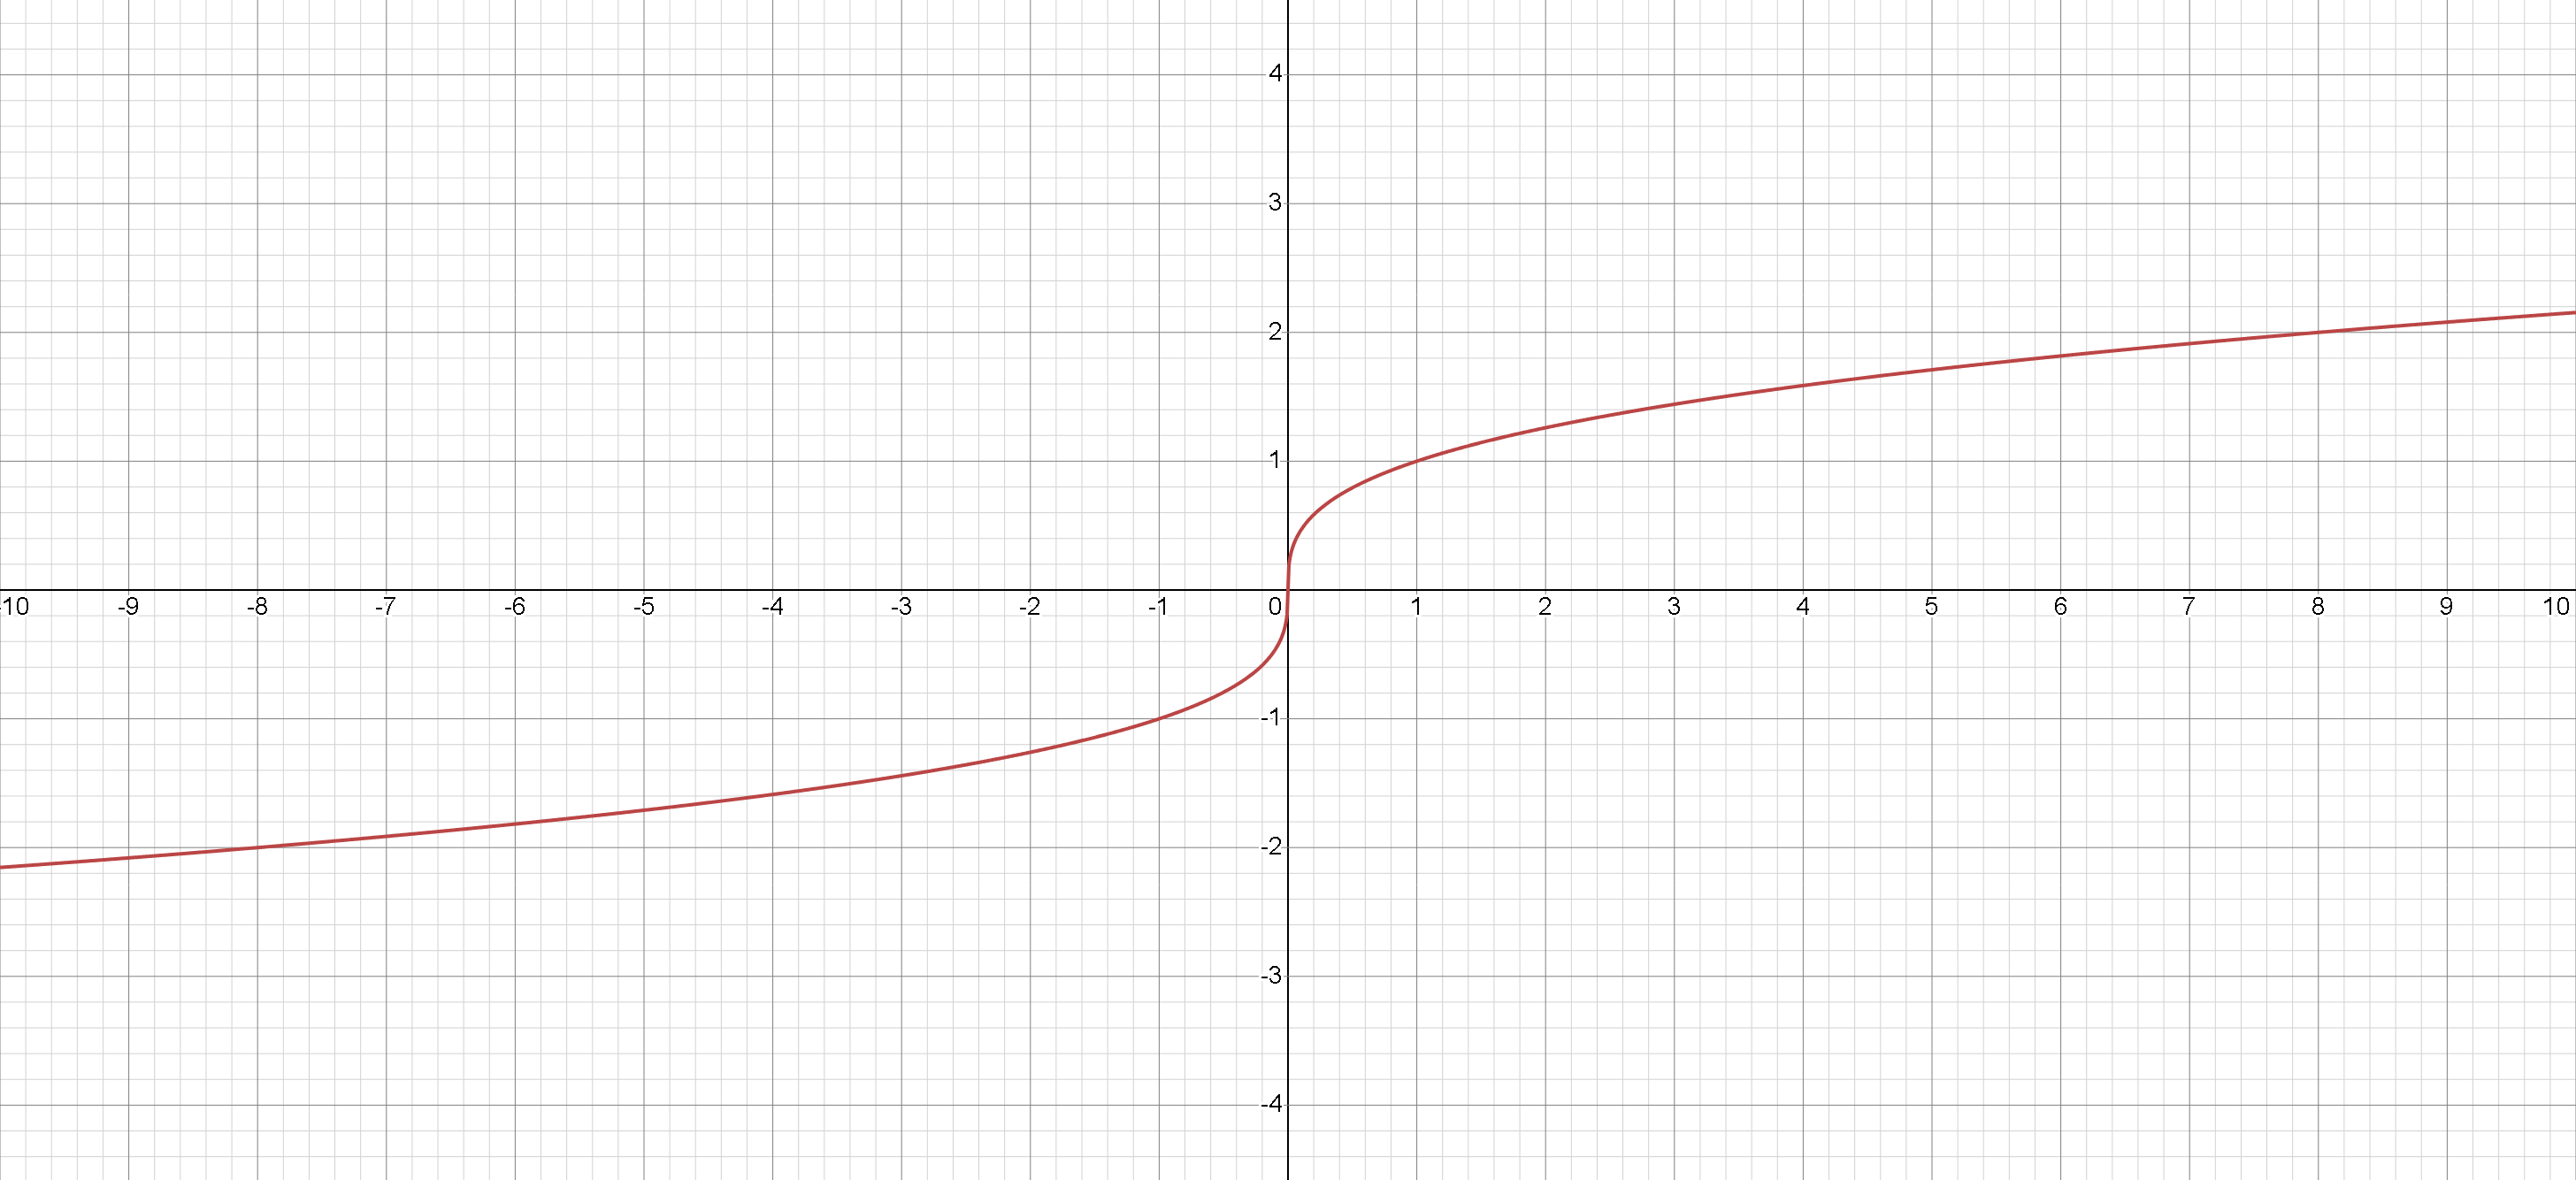
Cubic Root Function
The graph of y = ∛x passes through the origin and shows symmetry about the origin.
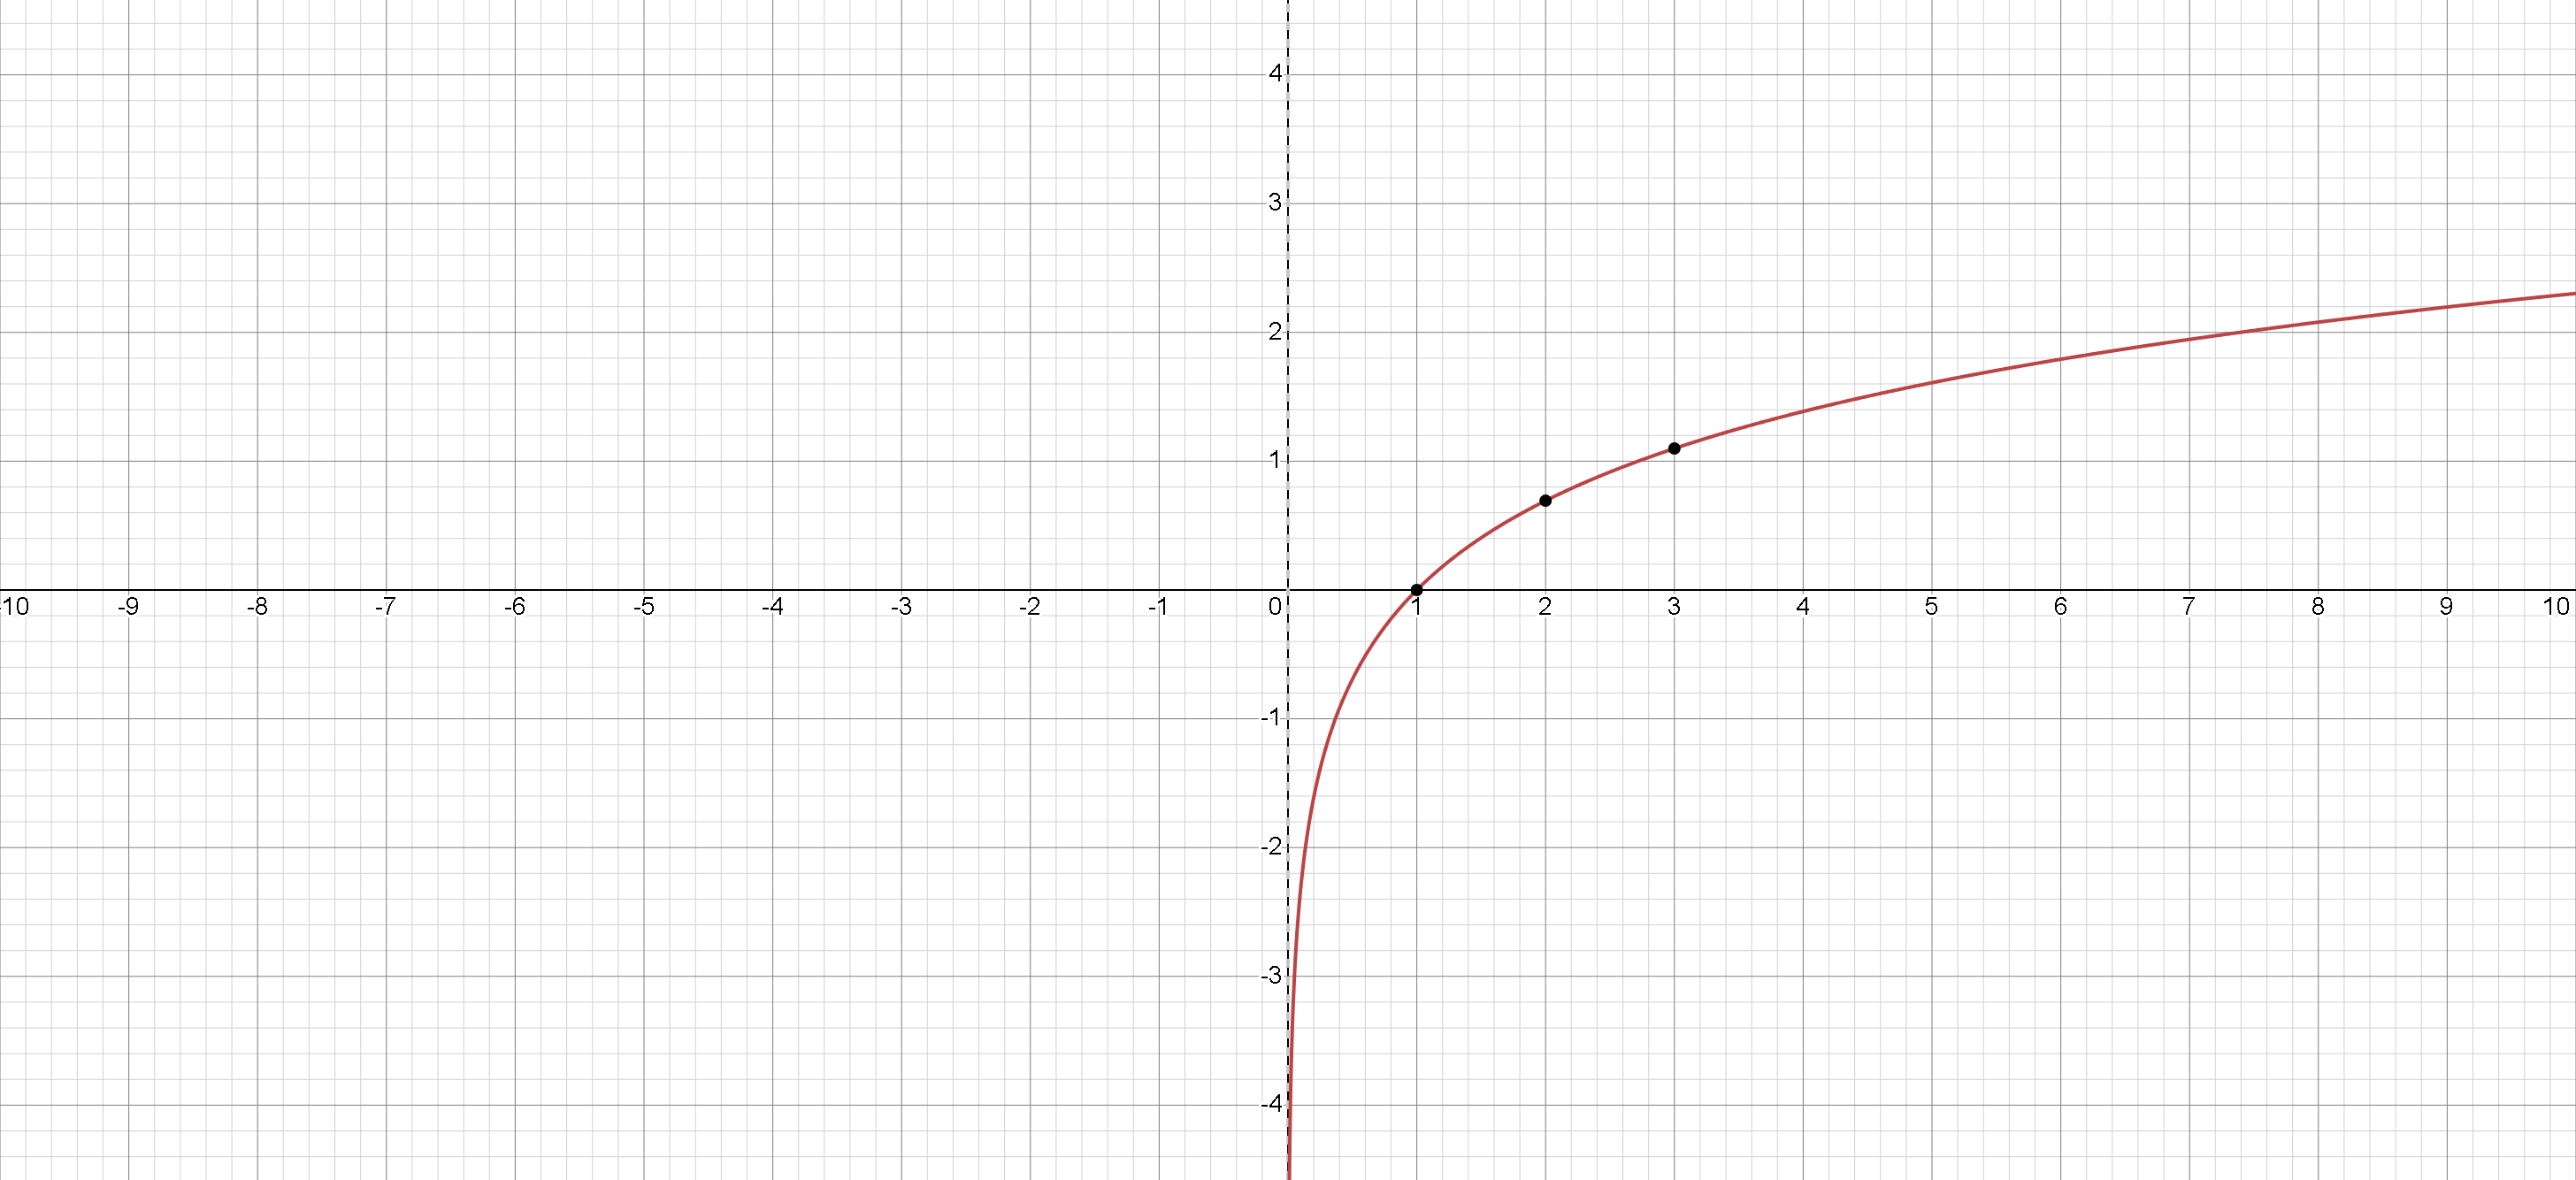
Natural Logarithmic Function
The graph of y = ln(x) shows a curve that grows slowly and is undefined for x≤0 .
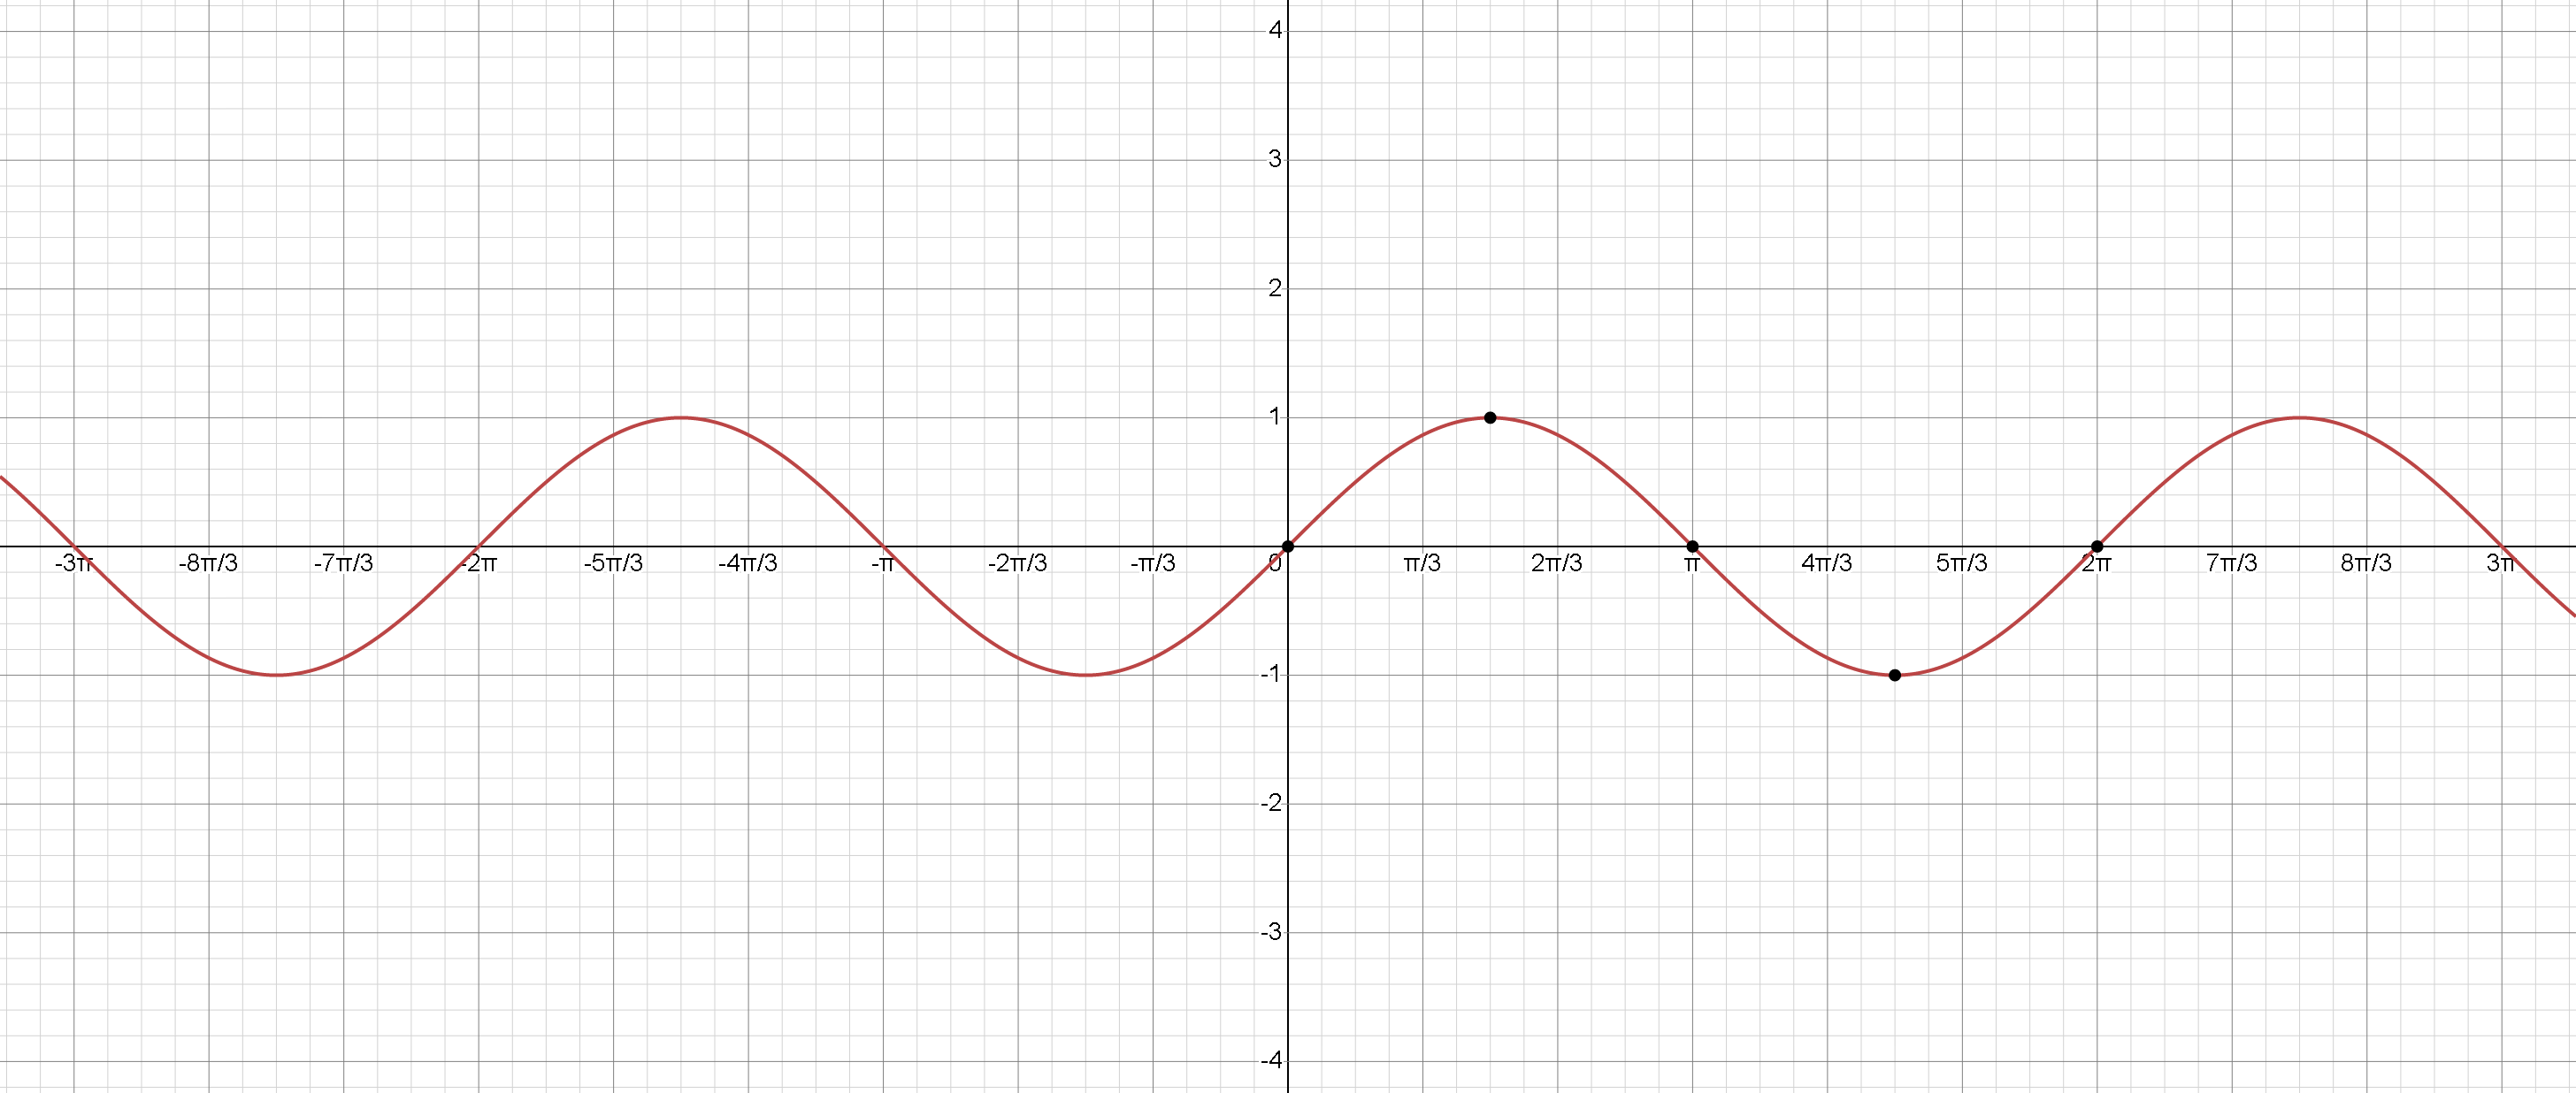
Sine Function
The graph of y = sin(x) oscillates between -1 and 1, with a period of 2π .
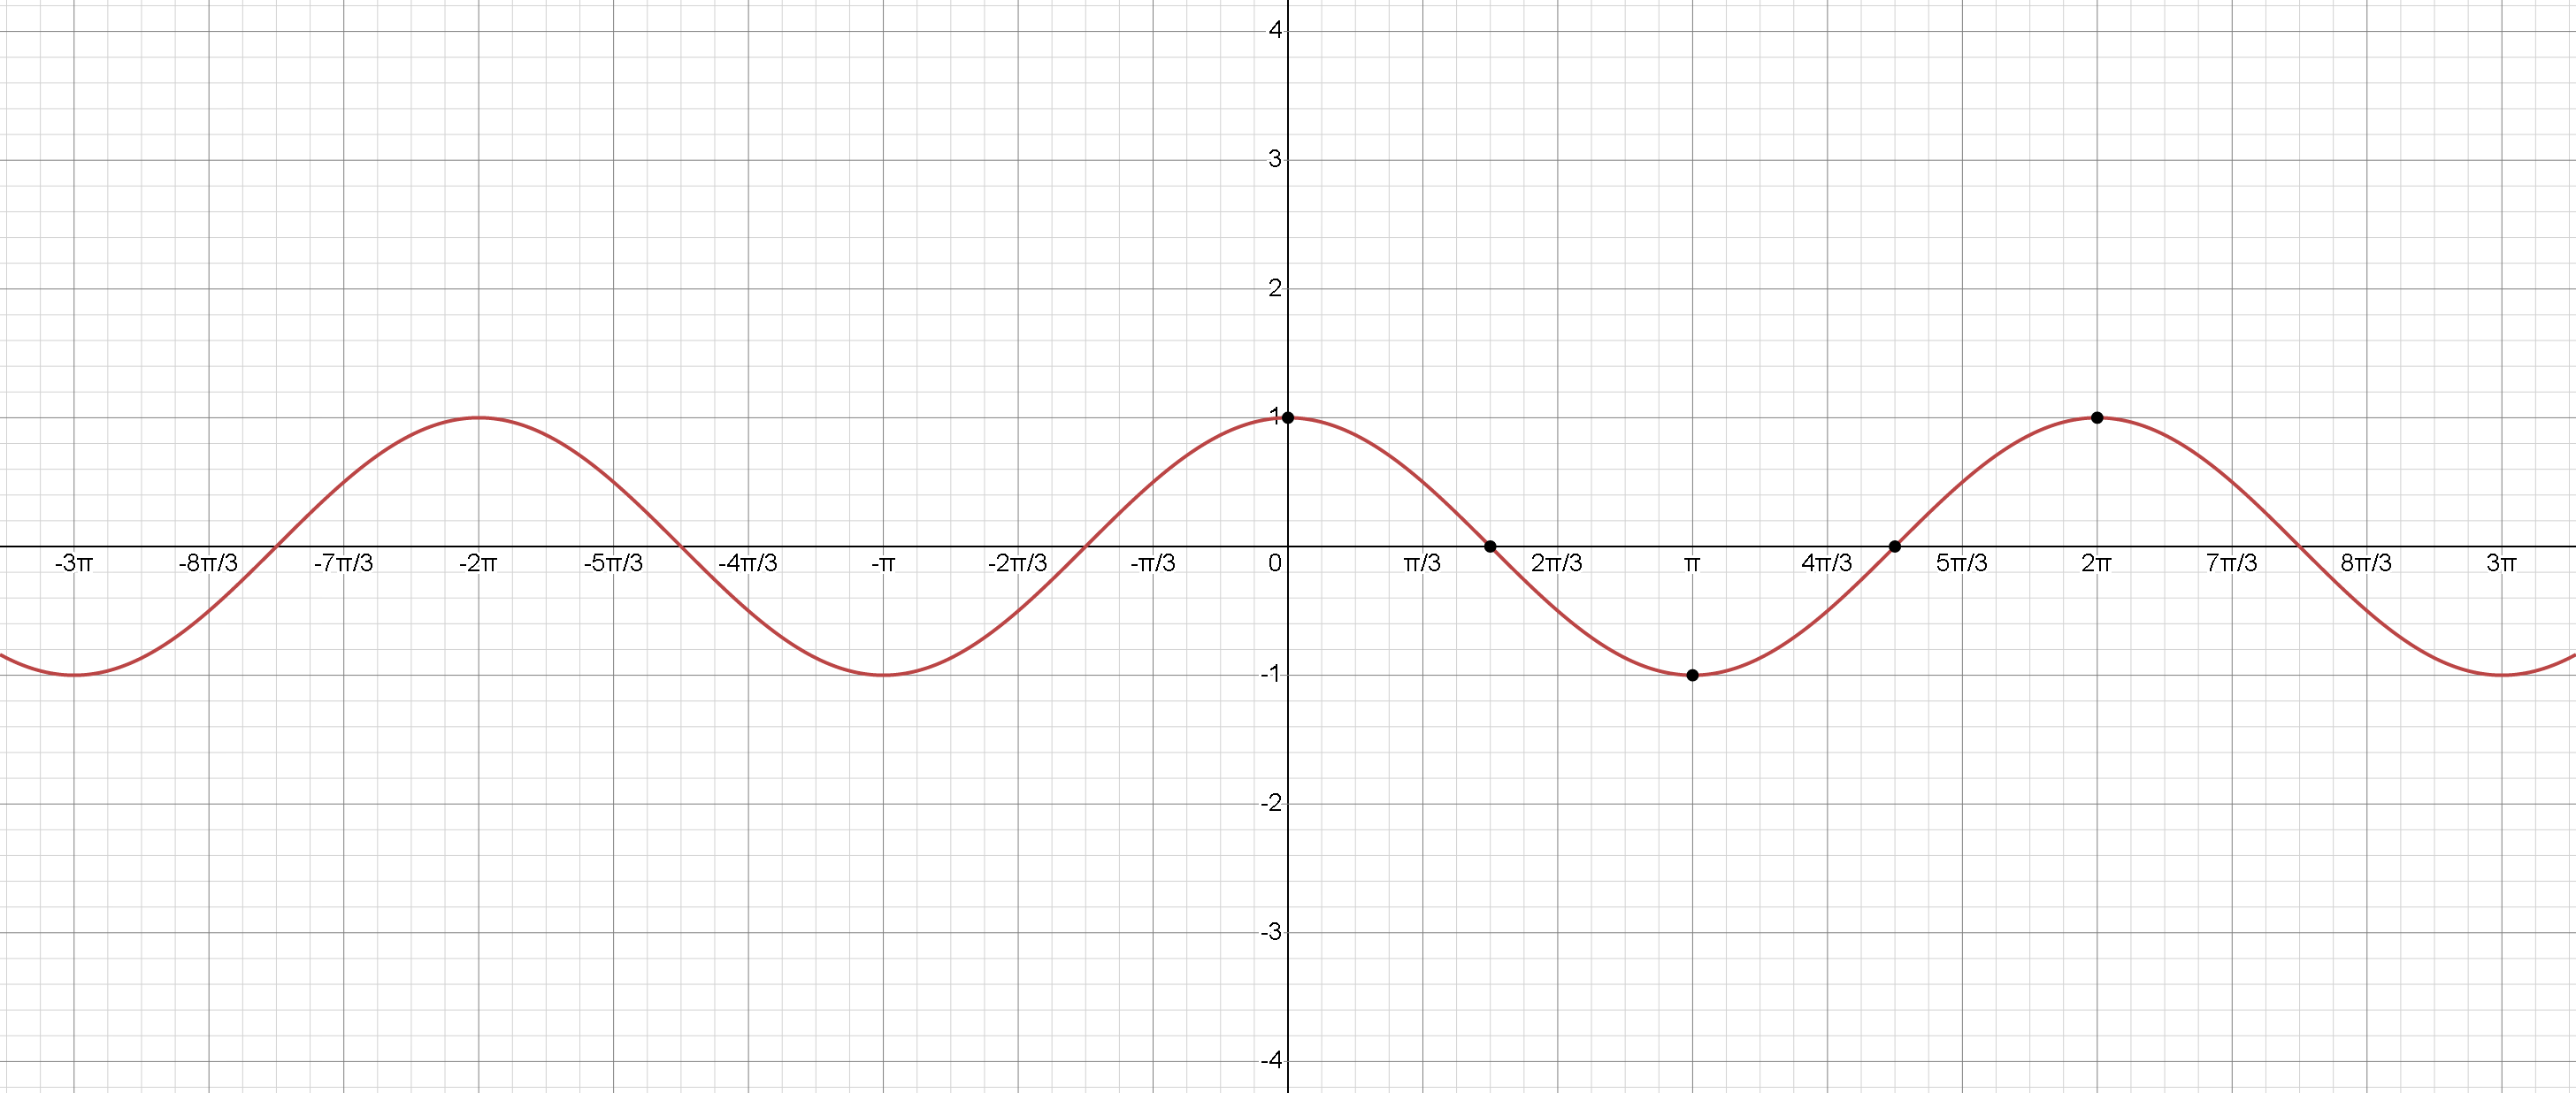
Cosine Function
The graph of y = cos(x) oscillates between -1 and 1, similar to the sine function but shifted.
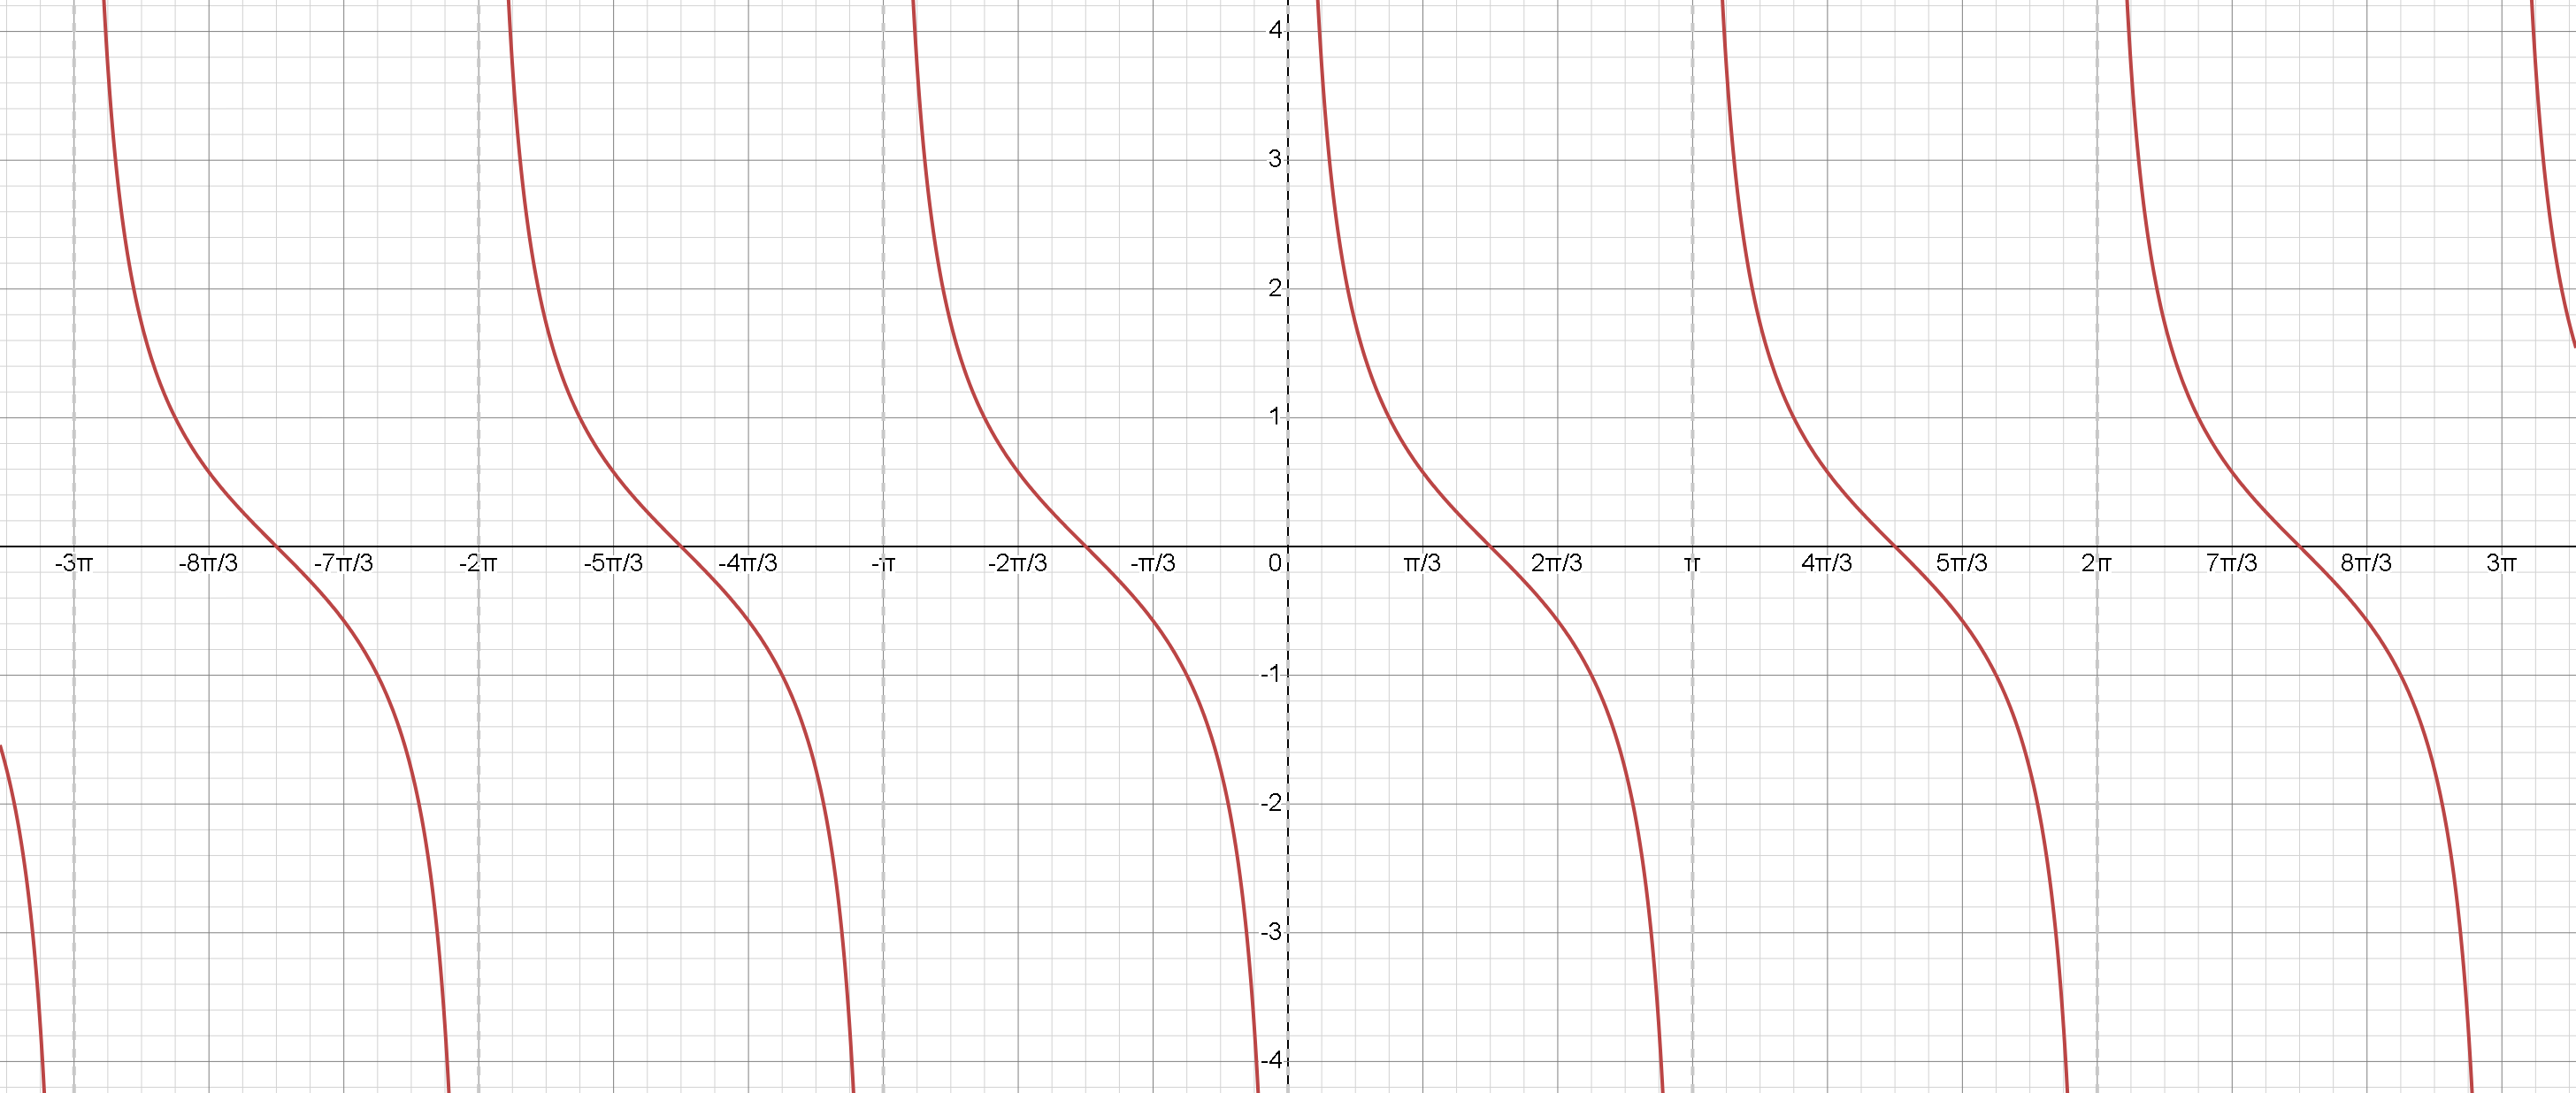
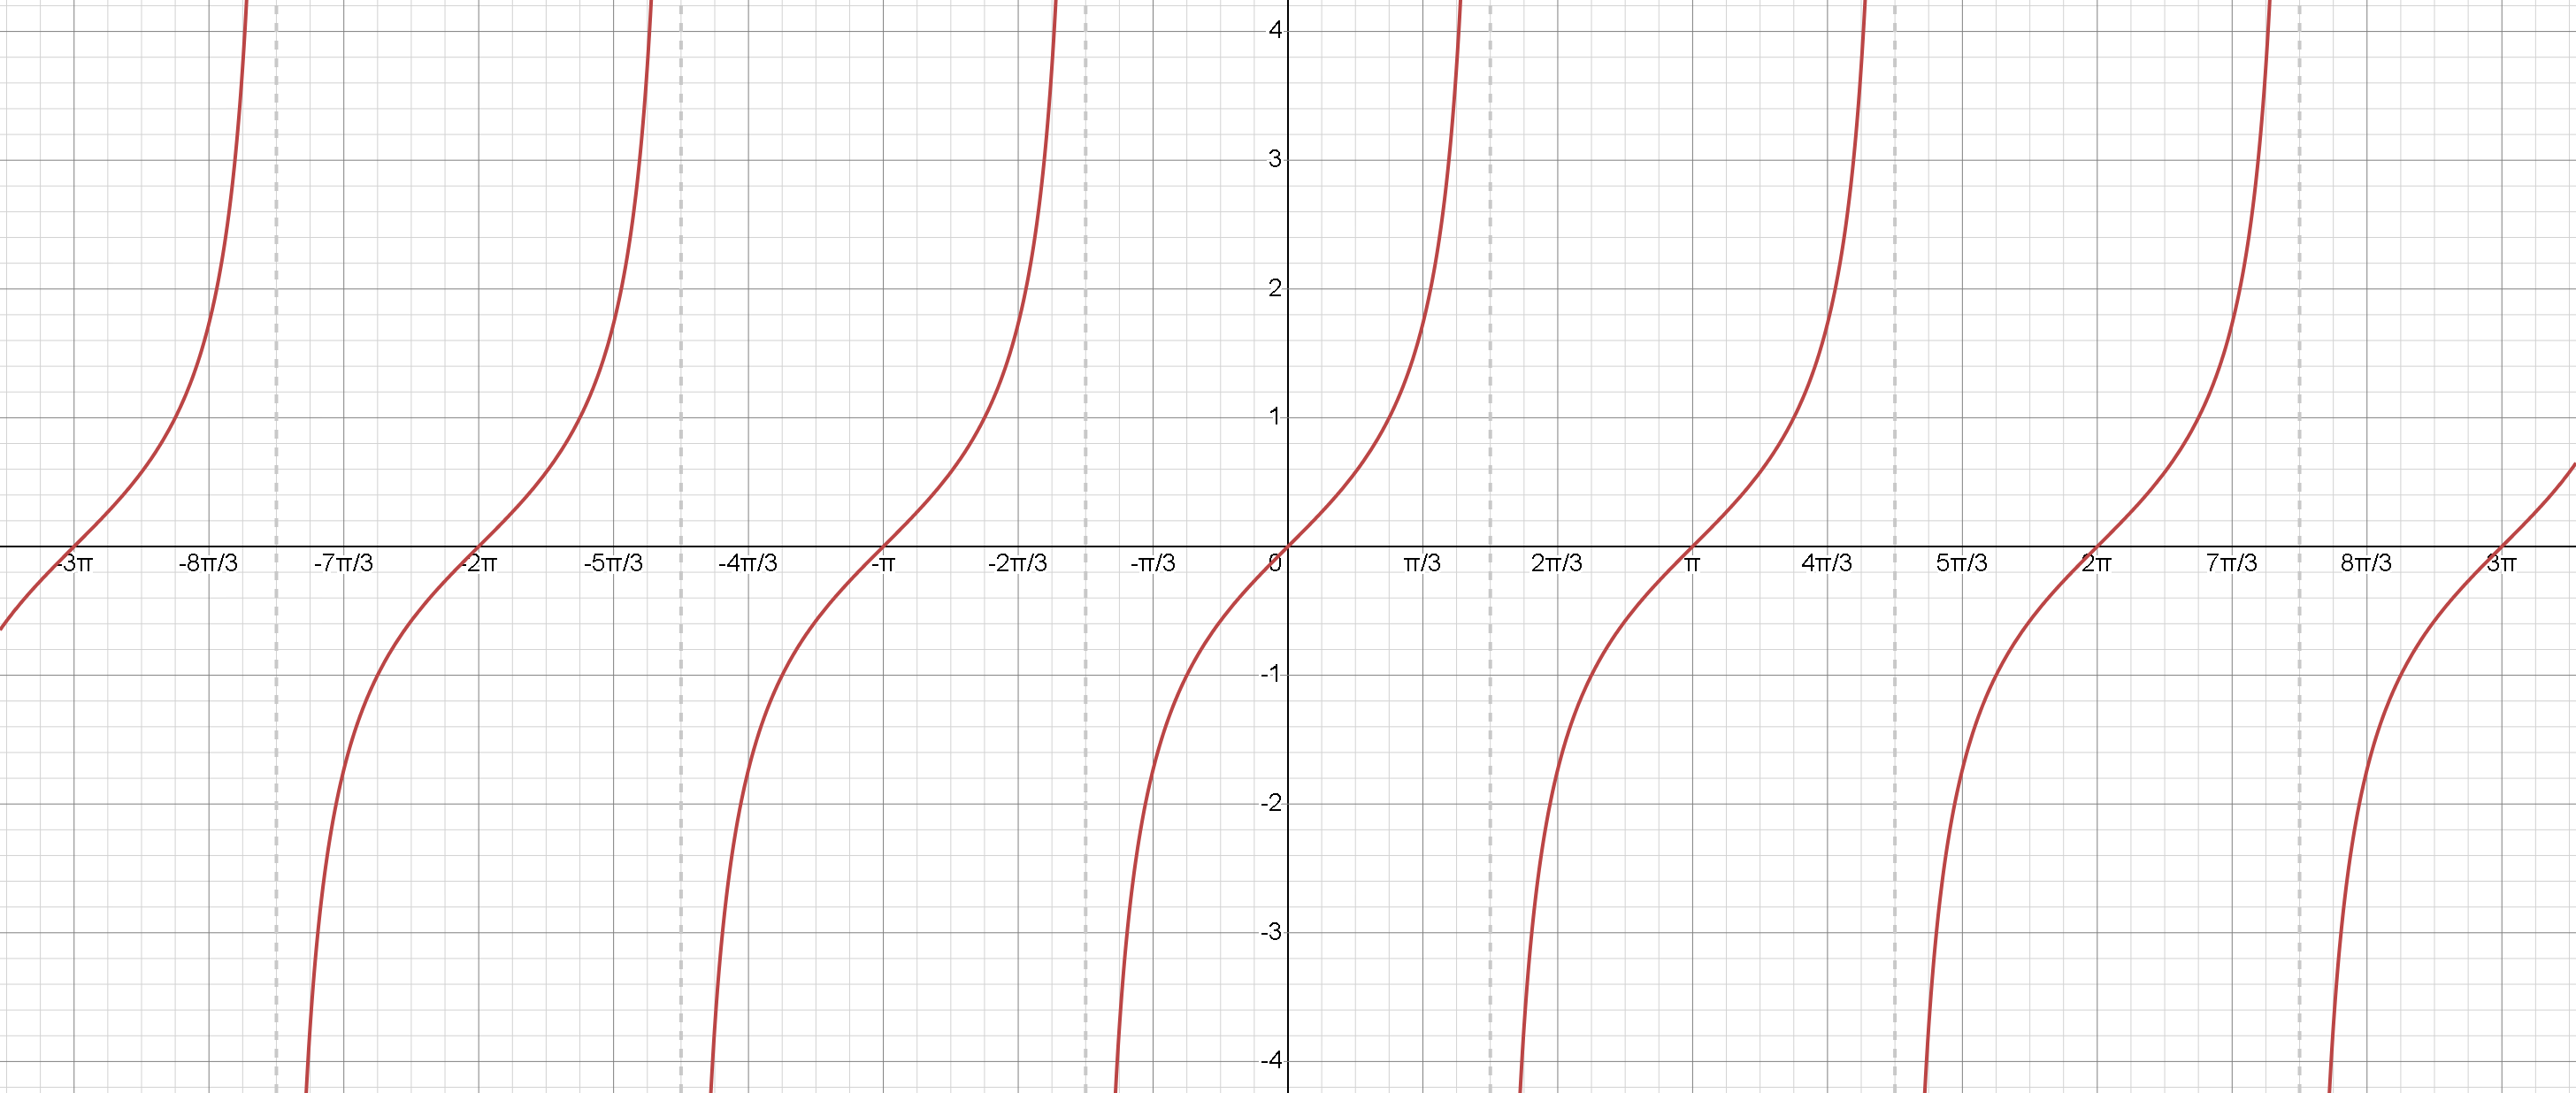
Tangent Function
The graph of y = tan(x) has periodic vertical asymptotes and repeats every π .
Cotangent Function
The graph of y = cot(x) is periodic with vertical asymptotes and repeats every π .